netobserv
What’s New in Network Observability 1.4
OpenShift Container Platform (OCP) is the leading Kubernetes environment for managing container-based applications. However, this is just the core platform. If you go to OperatorHub on the OpenShift web console (UI), you will see hundreds of optional operators, which are analogous to extensions for your browser. Buried in this operator gold mine is one called Network Observability. 
Network Observability 1.4, as the release number suggests, is not new. The team has put out four feature releases since its first general availability back in January 2023. It has grown significantly since I wrote a blog about Network Observability 1.0. This release supports OCP 4.11 and above.
The focus of this blog is the new features in 1.4, but a quick word about Network Observability. It is a tool that collects traffic flows using an eBPF agent and then enriches and stores them as logs and metrics to provide valuable insight and visualization into your network. In case you’ve been living under a rock (I mean, a gold crystal) in the Linux world, eBPF is the technology that allows you to extend the kernel capabilities without having to write a messy kernel module. It uses various probes to get some really cool statistics that would otherwise be difficult to get, which we will dive into later in this blog.
Features
All of the 1.4 features and enhancements can be put into four categories. They are:
- Hardware
- Support for SR-IOV interfaces
- Support on IBM Z architecture
- Traffic
- Packet drops
- DNS tracking information
- Export flows and dashboards without Loki
- Enhancements to Network Observability dashboards
- Round Trip Time (RTT) {developer preview}
- UI/UX
- Comparison operator field in filtering
- “Swap” source and dest
- “Back and forth” to include return traffic
- Vertical slider for changing scopes in Topology
- Performance and scalability
Some features require the Network Observability eBPF agent to be configured to enable that particular feature. This is done when you create a Flow Collector instance. After installing the Network Observability operator, click the Flow Collector link as shown below.

This brings up the Create FlowCollector panel. Follow the steps for that feature to enable it.
Hardware
SR-IOV Interfaces
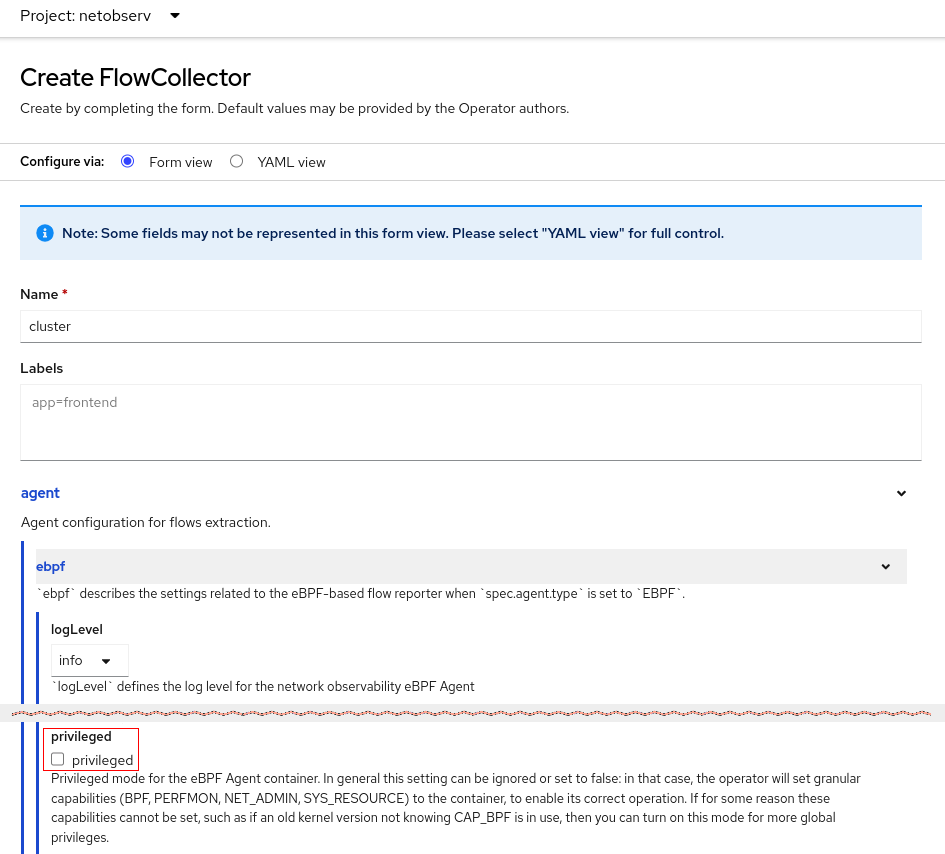
SR-IOV is a hardware standard to virtualize a NIC. In netdevice mode, the eBPF agent can now provide traffic flows that go through these interfaces. To enable this feature, when creating the FlowCollector instance, you must enable privileged mode. This is in the Create FlowCollector form view under agent > ebpf > privileged.

IBM Z
In the last release, we added support for IBM Power and ARM. We now officially support IBM Z as well. Long live the mainframes!
Traffic
On traffic features, Network Observability is providing additional information that is directly relevant to troubleshooting packet drops, DNS, and latency issues. We plan to publish more details about these features and how to use them in future blogs.
Packet drops
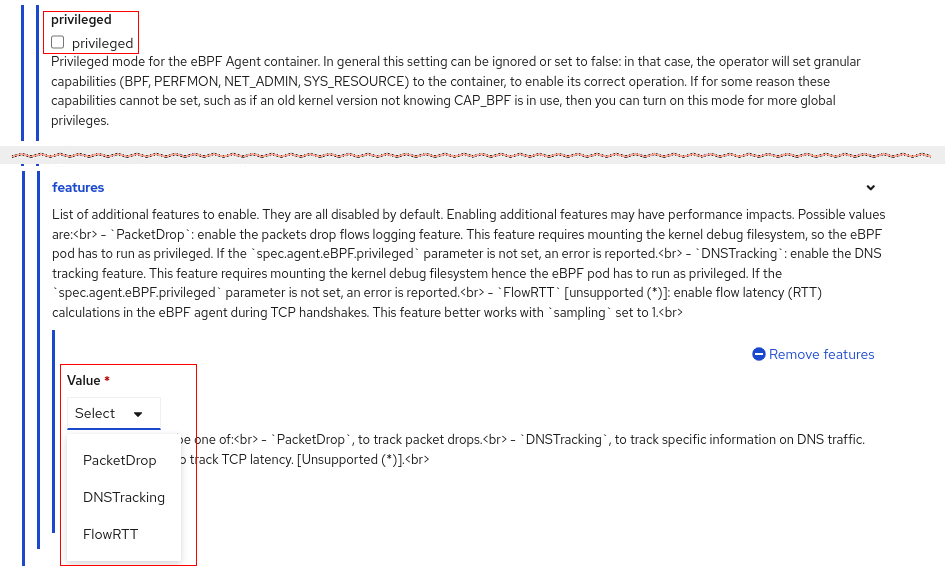
The eBPF agent can get real-time packet drops per flow for TCP, UDP, SCTP, and ICMPv4/v6 (such as ping). To enable this feature, when creating the FlowCollector instance, you must enable privileged mode and the PacketDrop feature. This is in the Create FlowCollector form view under agent > ebpf > privileged and agent > ebpf > features.
Now decide how you want to filter packet drops. In Observe > Network Traffic under Query options, select whether to show flows that have all packets dropped, at least one packet dropped, no packets dropped, or no filter. Be careful if you select “no packets dropped”, as that means you won’t see flows with packet drops. Then in the filter field, there are new filters for the TCP state and the drop cause. See the highlighted red areas below that it’s referring to in web console. You also need to be running OCP 4.13 or higher.

The Overview tab has several new packet drop graphs, two of which are shown below.
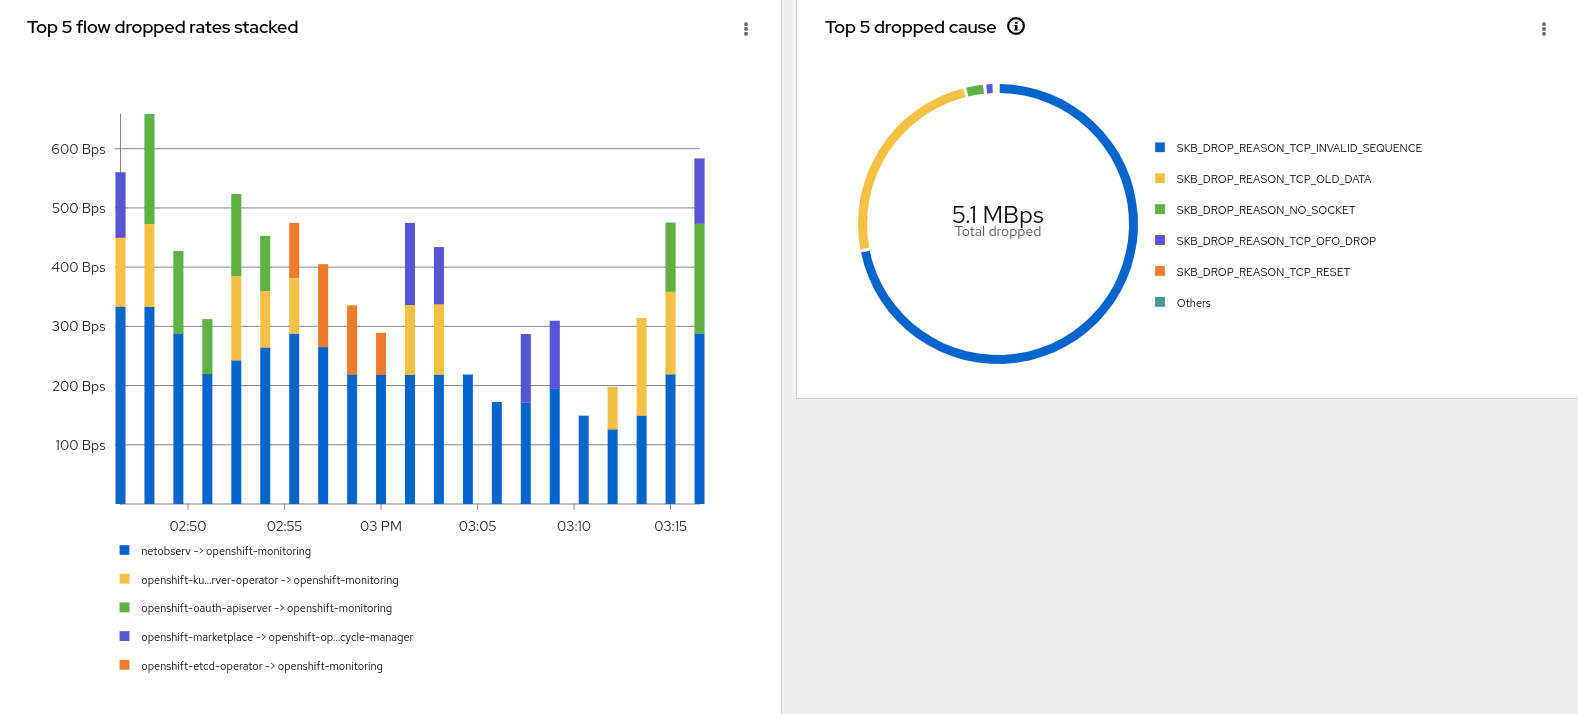
Click Show advanced options (which then becomes Hide advanced options) to reveal Manage panels. Click this link to choose what graphs to display.

The Traffic flows tab shows the bytes and packet counts of what has been dropped in red. The Topology tab displays a red link between vertices where packet drops have occurred.


DNS tracking information
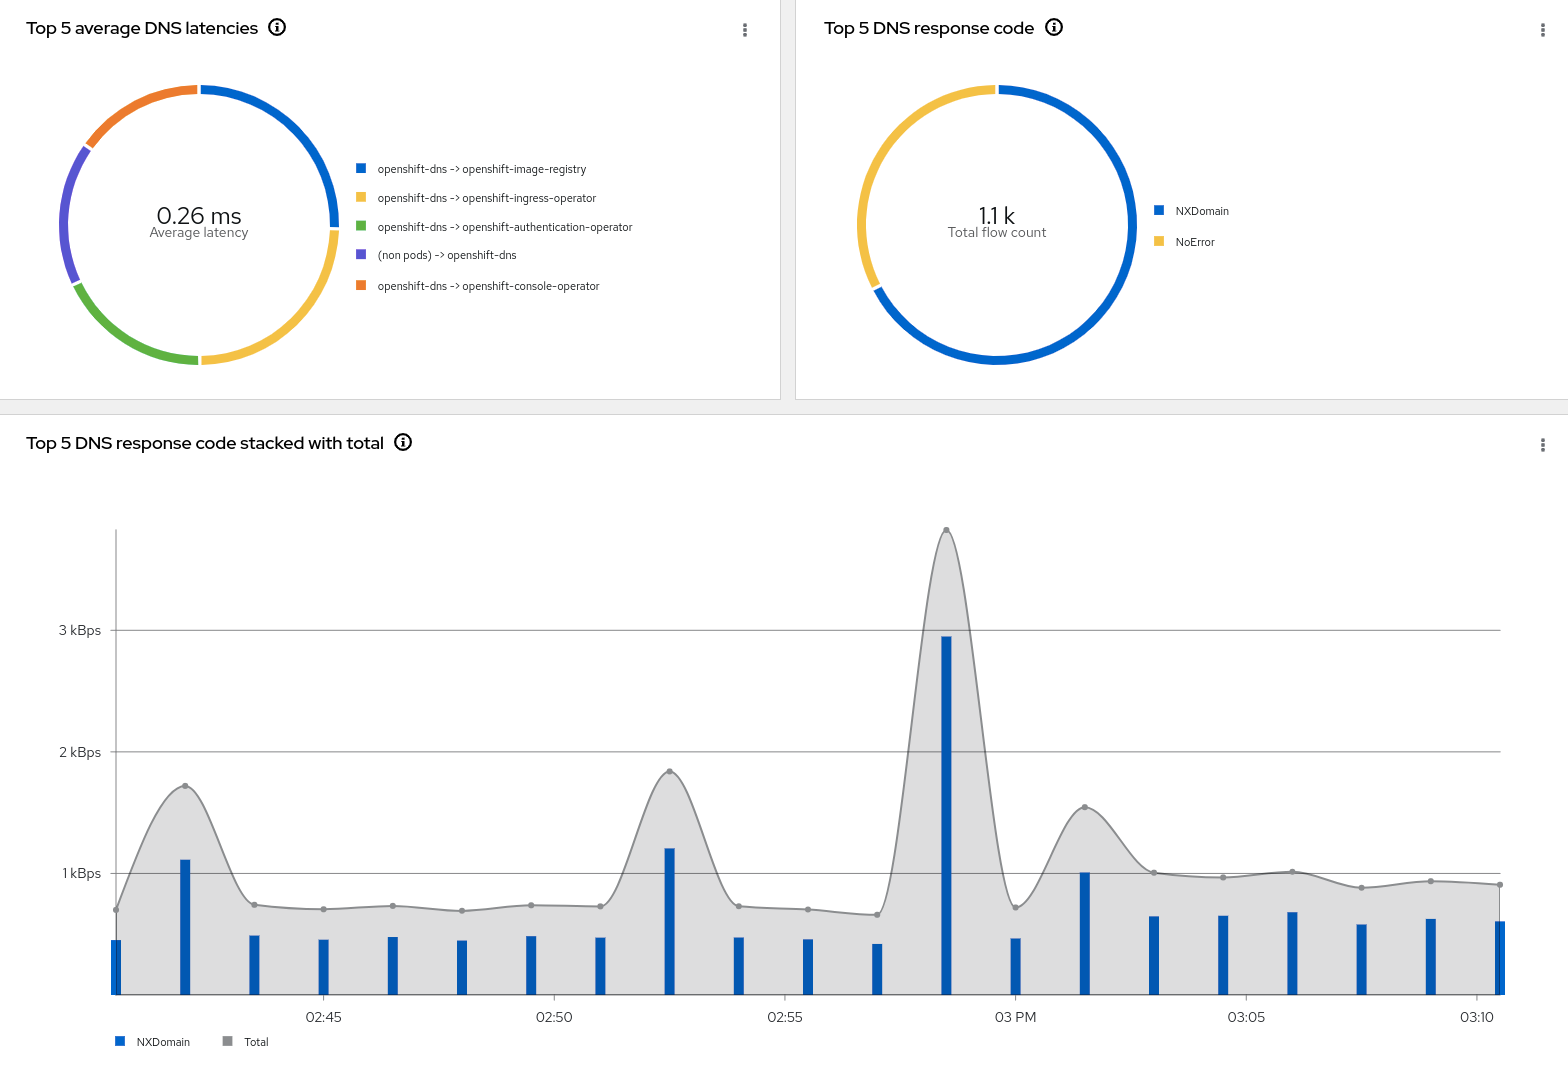
DNS is one networking area that is the source of potential problems. This feature provides information on DNS ID, latency, and response code and the ability to filter on these fields. To enable this feature, when creating the FlowCollector instance, you must enable privileged mode and the DNSTracking feature. This is in the Create FlowCollector form view under agent > ebpf > privileged and agent > ebpf > features. See the screenshot in the Packet drops section above on where to configure this.
Like the Packet Drops feature, there are new DNS graphs in the Overview tab. See above on how to display them. There are also new DNS columns in the traffic flows table.
Export flows and dashboards without Loki
If you only want to export flows to a Kafka consumer or to an IPFIX collector, it is no longer necessary to install Loki. Without Loki and internal flow storage, the netobserv console plugin is not installed, which means you don’t get the Observe > Network Traffic panel and hence no Overview graphs, Traffic flows table, and Topology. You will still get flow metrics in Observe > Dashboards.
Enhancements to Network Observability dashboards
Speaking of dashboards, in Observe > Dashboards, NetObserv / Health selection, there is a new Flows Overhead graph that shows the percentage of flows generated by Network Observability itself.
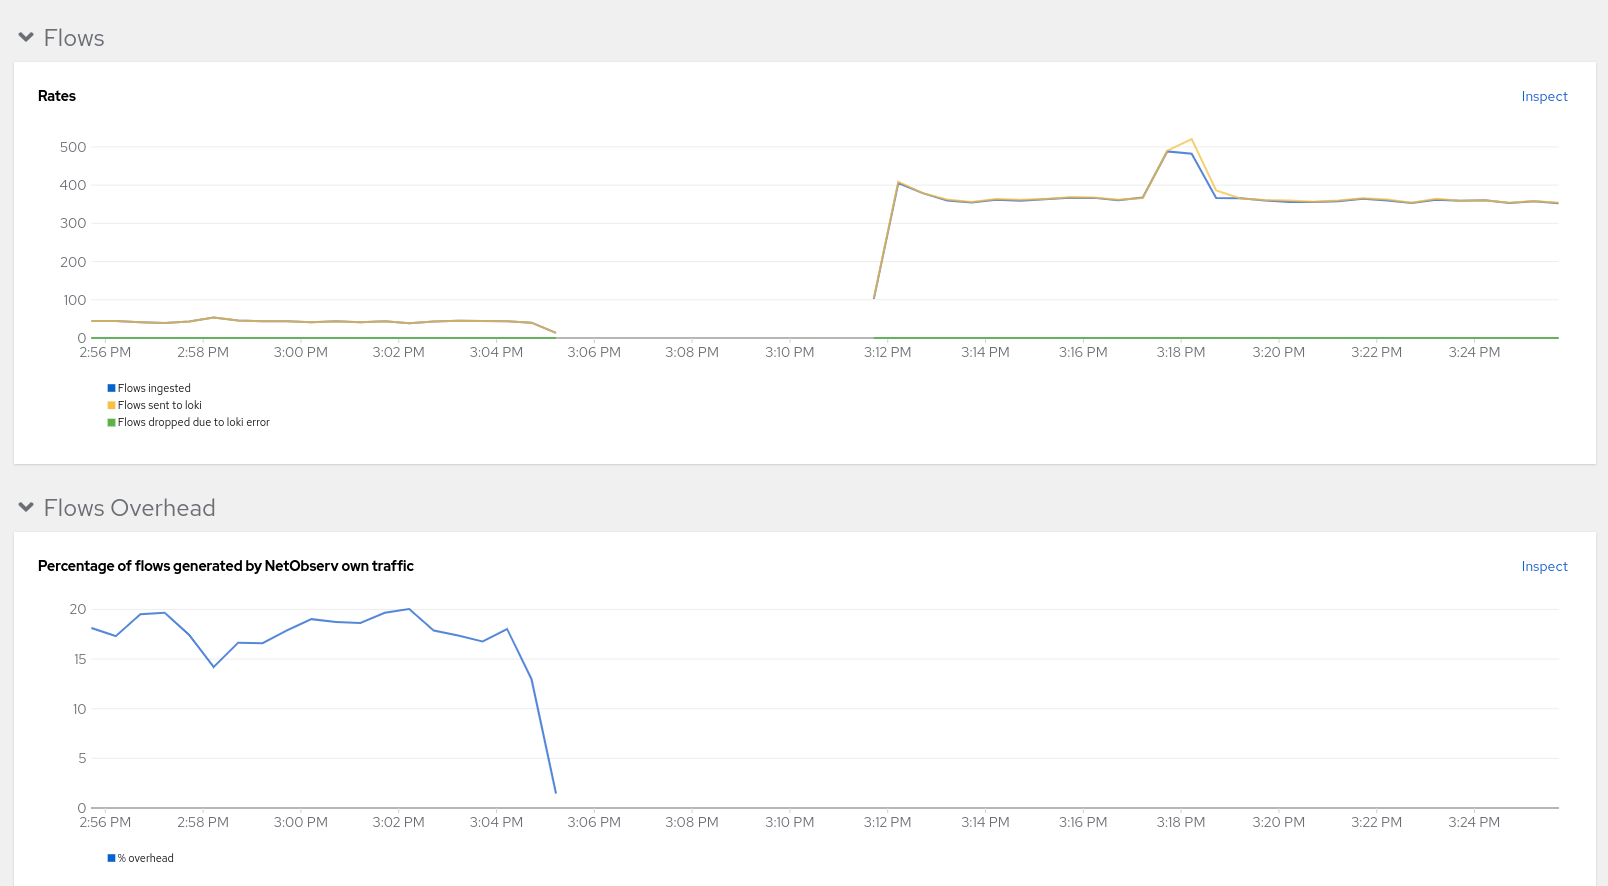
The dashboard under NetObserv was also changed to separate applications and infrastructure.

Round Trip Time (RTT)
Round Trip Time (RTT) is a development preview feature that shows the latency for the TCP handshake process on a per-flow basis. To enable this feature, when creating the FlowCollector instance, you must enable the FlowRTT feature. This is in the Create FlowCollector form view under agent > ebpf > features. See the screenshot in the Packet drops section above on where to configure this. Note the eBPF privileged feature is not required. It is also recommended to set sampling to 1 (or a low value) in order to not miss the TCP handshaking packets (SYN and ACK).
The Overview tab has two new RTT graphs shown below.
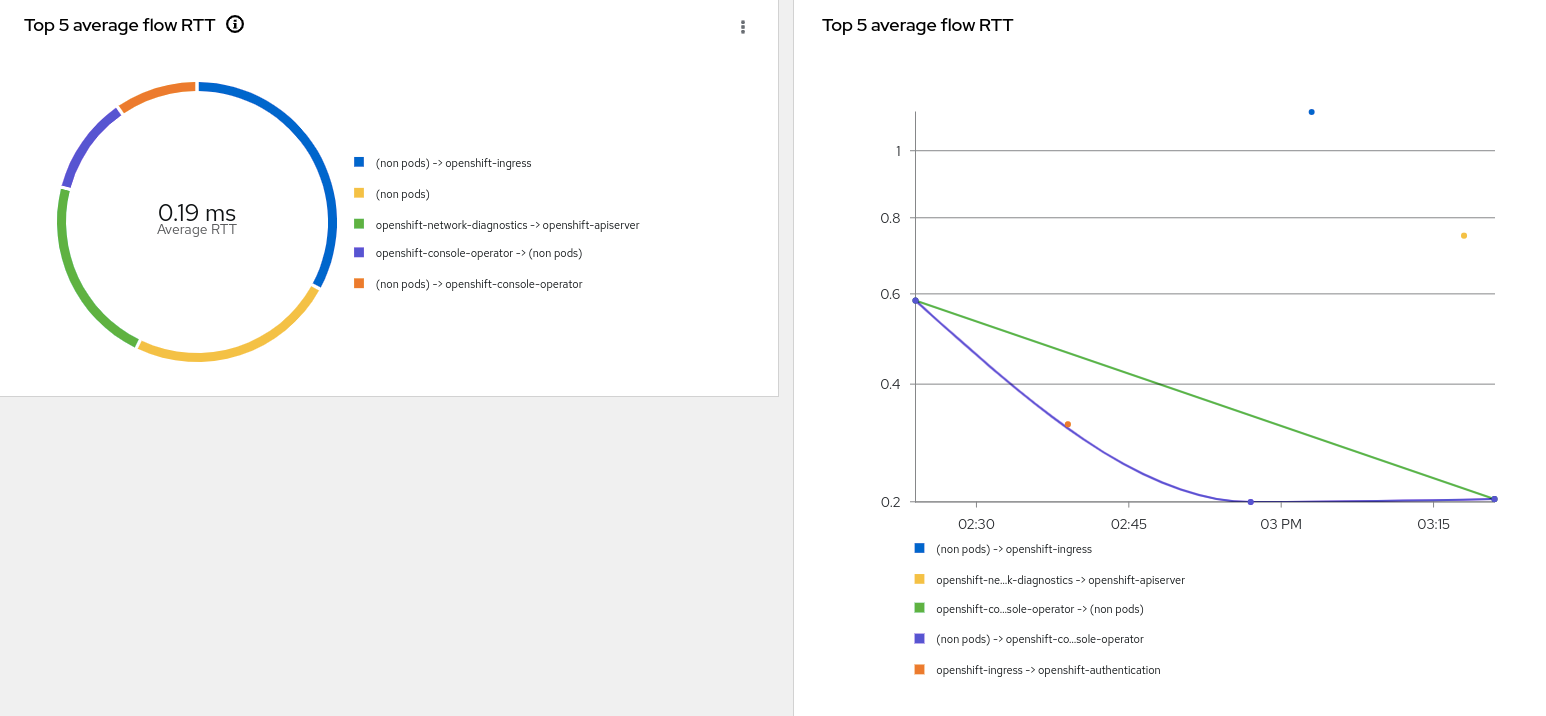
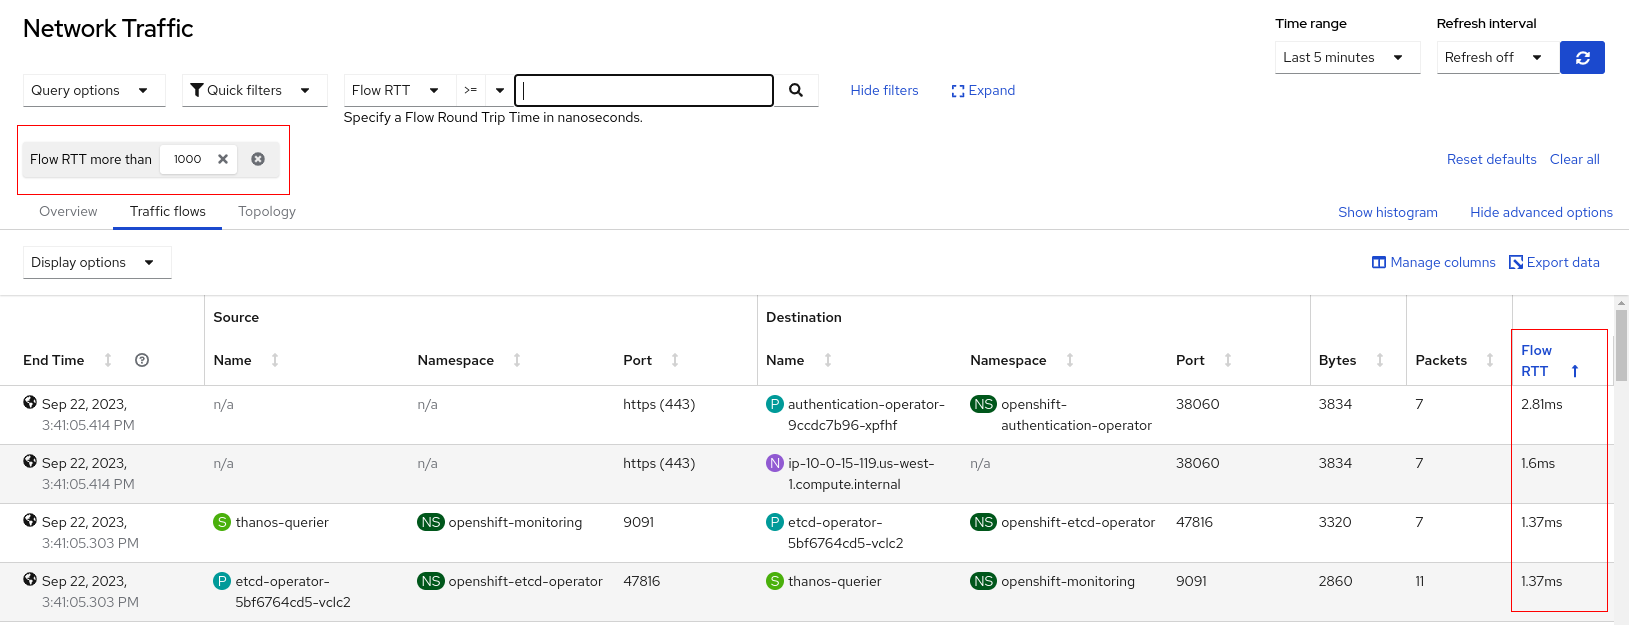
The Traffic flows tab adds the Flow RTT column. In the table below, it filters and displays all flows that take more than 1 millisecond (the value is in nanoseconds).
UI/UX
Comparison operator field in filtering
To the left of the filter field (see figure above on Query options) is a new field for the comparison operator. Previously, the only comparison operator was an implied “equals” comparison. Now, you can filter on “not equals” or “more than” for numeric value comparisons such as DNS latency or Flow RTT.
“Swap” source and dest
When you click Swap in the filter section, it changes all the source values to dest and vice versa. This makes it convenient to do this operation.

“Back and forth” to include return traffic
Before this change, Query options had a Reporter section where you chose Source, Destination, or Both. For external traffic, you either got half the traffic or all the traffic duplicated depending on your selection. This now gives you two similar options. Choose One way (default) to get the traffic exactly in one direction. Choose Back and forth to let it figure out and do the right thing for you. You don’t have to think about ingress, egress… I digress! The Direction column in the flows table will show one of ingress, egress, or the new inner, which indicates inter-node traffic.

Vertical slider for changing scopes in Topology
The scope in Topology determines what is shown for the vertices in the graph. The highest level view is to show Kubernetes nodes for the vertices by selecting Node. The next level is Namespace, followed by Owner (typically a Deployment, StatefulSet, or DaemonSet), and finally Resource for the specific pod to pod/service communication. Prior to this, the selection was under Query options. Now it is visible as a vertical slider on the topology as shown on the right.
Performance and scalability
We are constantly looking to improve the performance and scalability of the operator at the same time while reducing the resource footprint without compromising on visibility that matters. We have published a set of guidelines on the same, and we are looking to evolve this over a period of time.
Conclusion
I hope you enjoy the new features. This was a high level overview of this release and going forward, we plan to publish other blogs to describe the features in more details. In the meantime, continue mining for that data nugget!
Special thanks to Julien Pinsonneau, Mohamed Mahmoud, Joel Takvorian, Dave Gordon, Sara Thomas, and Deepthi Dharwar for providing feedback, advice, and ensuring accuracy in this article.