Enhancing NetObserv for Kubernetes Service Flows using eBPF
Enhancing NetObserv for Kubernetes Service Flows using eBPF: Adding Translated Endpoint Information
Introduction
In a cloud-native environment, Kubernetes has become the de facto standard for managing containerized workloads. While its service discovery and load-balancing features are robust, gaining visibility into the actual endpoints serving traffic often requires complex instrumentation or external tooling. This is where eBPF (extended Berkeley Packet Filter) shines, offering a way to deeply observe and enrich Kubernetes service flows without intrusive changes to your applications.
In this blog, we'll explore how eBPF can be used to add translated endpoint (xlated endpoint) information to Kubernetes service flows, providing insights into backend behavior and improving observability.
The Challenge
When traffic flows through a Kubernetes Service, it often gets abstracted away by kube-proxy or other load balancers.
For example, a request to my-service on ClusterIP is transparently routed to one of the available pods.
However, most of the observability solutions tend to capture both the service traffic and the virtual service endpoint
as two separate flows.
This lack of granularity makes troubleshooting and optimization more challenging.
To solve this, we can:
Capture the network flows at the kernel level.
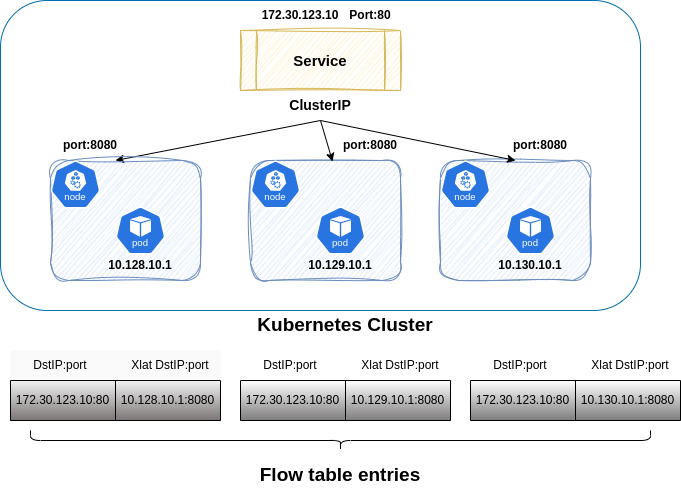
Enrich them with translated endpoint information, showing not only the service but also the specific backend pod. The Following diagram shows an example of kubernetes ClusterIP service and the translated endpoint information

How eBPF Can Help
You can execute custom programs using eBPF in the Linux kernel, making it an ideal tool for network observability.
Notable benefits of using eBPF include the following:
-
Granular Observability: Directly see which pod served a request.
-
Low Overhead: Operates in the kernel with minimal impact on performance.
-
Dynamic Updates: Respond to changes in Kubernetes without requiring application restarts.
-
Simplified Architecture: No need for sidecars or intrusive network plugins.
Here’s a high-level approach:
1- attach eBPF Programs:
Use eBPF programs to hook into kernel networking events, such as kprobe on functions like nf_nat_manip_pkt
which will enable network observability eBPF agent to learn about all network translations events
done via Linux Conntrack Tool
2- enrich Flow Logs: As network packets are processed, the eBPF hook will augment flow logs with metadata about the translated endpoint.
This will include:
-
Source Pod IP
-
Source Port
-
Destination Pod IP
-
Destination Port
How to enable Packet Translation enrichment feature
To enable packet translation enrichment feature, create a FlowCollector resource with the following feature enabled
apiVersion: flows.netobserv.io/v1beta2
kind: FlowCollector
metadata:
  name: cluster
spec:
  agent:
    type: eBPF
    ebpf:
      features:
      - "PacketTranslation"
Note:
For optimal results, it is recommended to set sampling to 1 to ensure no translated flows are lost.
However, this may come at the cost of increased CPU and memory usage.
Example
Let's configure a ClusterIP Kubernetes service to try this feature!
1- Configure a ClusterIP Kubernetes service using the following example yaml:
---
apiVersion: v1
kind: Pod
metadata:
  name: client
  namespace: xlat-test
spec:
  containers:
  - name: hello-pod
    image: bmeng/hello-openshift
    ports:
    - containerPort: 8080
      hostPort: 9500
---
apiVersion: v1
kind: Pod
metadata:
 name: hello-pod
 namespace: xlat-test
 labels:
  app: hello-pod
spec:
 containers:
 - name: hello-world
   image: gcr.io/google-samples/node-hello:1.0
   ports:
   - containerPort: 8080
     protocol: TCP
---
kind: Service
apiVersion: v1
metadata:
 name: hello-pod
 namespace: xlat-test
spec:
  ports:
  - name: http
    port: 80
    protocol: TCP
    targetPort: 8080
  selector:
    app: hello-pod
  type: ClusterIP
2- Check the created service to find the ClusterIP and Port:
oc describe svc -n xlat-test
Name:              hello-pod
Namespace:         xlat-test
Labels:            <none>
Annotations:       <none>
Selector:          app=hello-pod
Type:              ClusterIP
IP Family Policy:  SingleStack
IP Families:       IPv4
IP:                172.30.165.151
IPs:               172.30.165.151
Port:              http  80/TCP
TargetPort:        8080/TCP
Endpoints:         10.129.0.37:8080
Session Affinity:  None
Events:            <none>

oc get pods -n xlat-test
NAME        READY   STATUS    RESTARTS   AGE
client      1/1     Running   0          5s
hello-pod   1/1     Running   0          8m54s
3- Next, you can send traffic to this service IP and check the enriched flows on the network observability console:
while true; do oc exec -i -n xlat-test client -- curl 172.30.165.151:80 ; sleep 1; done
4- From the network observability console Network Traffic page, click the Taffic flows tab and filter on
Traffic destination Kind is Service in the xlat-test namespace:


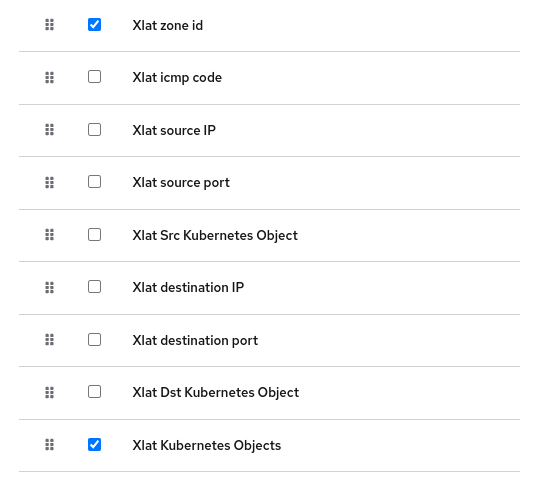
The following shows possible packet translation columns options.
Currently zoneid, Src Kuberbetes Object and Dst Kubernetes Object are the visible columns by default:

Note: There are some special IPs that can't be enriched, for example:
- kubernetes API server IP
172.20.0.1 - ovn kubernetes special IPs
169.254.0.0/16andfd69::/64
Conclusion
eBPF unlocks new possibilities for observing and managing Kubernetes service flows. By enriching flow data with translated endpoint information, you can gain deeper insights into your workloads, streamline debugging, and enhance security.
Feedback
We hope you liked this article! NetObserv is an open source project available on github. Feel free to share your ideas, use cases or ask the community for help.
