Network Observability On Demand 1.8 Update
Julien Pinsonneau

Julien Pinsonneau
@jpinsonneauUpdate
Check out the revised version of this post on the Red Hat developers blog: Network Observability On Demand 1.8 Update.
Network Observability On Demand 1.8 Update
Thanks to: Joël Takvorian, Mehul Modi and Sara Thomas for reviewing
------------------------------------------------------------------------
         _  _     _       _                       ___ _    ___
        | \| |___| |_ ___| |__ ___ ___ _ ___ __  / __| |  |_ _|
        | .' / -_)  _/ _ \ '_ (_-</ -_) '_\ V / | (__| |__ | |
        |_|\_\___|\__\___/_.__/__/\___|_|  \_/   \___|____|___|

------------------------------------------------------------------------
Since we introduced the Network Observability CLI, numerous features have been added. This article covers the improvements in version 1.8 and provide some concrete examples.
New Options Available
This update adds several options to the CLI, covering more scenarios and enabling scripting on top of the tool.
Operate in the Background
The --background option allows you to start a flow or packet capture without connecting your terminal to the collector pod. This enables you to let the capture run in the background while you work on something else.
You can check the capture's progress using the follow command.
The capture is ending automatically when either maximum bytes (50MB) or time (5m) is reached. You can update these accordingly using the --max-bytes and --max-time options.
The stop command also allows you to end the capture manually.
In both cases, the collector pod keeps running to let you download the output locally using the copy command.
Once the job is complete, you cleanup everything.
oc netobserv flows --background # Run a flow capture in the background

oc netobserv follow             # Show current capture progress

oc netobserv stop               # Stop the capture, keeping the collector pod alive

oc netobserv copy               # Copy the output

oc netobserv cleanup            # Remove all
Customizable Namespace
You can now customize the capture namespace using the NETOBSERV_NAMESPACE environment variable. When the CLI starts, it automatically checks if this namespace exists and stops if it finds any conflict with a pending capture. This is particularly useful if you want to run captures in parallel.
NETOBSERV_NAMESPACE=my_ns oc netobserv [flows|packets|metrics|follow|stop|copy|cleanup]
Subnets Labelling (for OCP clusters)
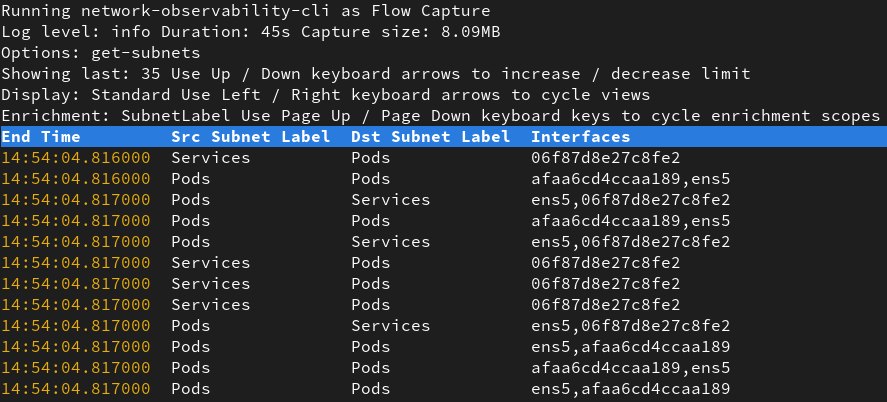
The tool can now read OpenShift configurations from cluster-config-v1 and network to identify Machine, Pods, and Services subnets using the --get-subnets option. This automatically adds SrcSubnetLabel and DstSubnetLabel to your flows.
You can see subnets being configured during the creation of the agents:
creating flow-capture agents:
opt: get_subnets, value: true
Found subnets:
    Services: "172.30.0.0/16"
    Pods: "10.128.0.0/14"
    Machines: "10.0.0.0/16"
Enhanced Data Filtering
Filtering is crucial to gather precise network data without involving excessive resources and storage. The CLI focuses on this area, allowing you to deploy agents only where needed and fine-tune what's captured.
Assigning Agents to Nodes
It's now possible to define agents nodeSelector to capture on a subset of nodes. You can rely on existing labels or create a dedicated one for this usage. For example, you can run the agents on the node with the kubernetes.io/hostname:my-node label with the following command:
oc netobserv flows --node-selector=kubernetes.io/hostname:my-node
eBPF Filters
Agents recently introduced the ability to filter on IPs, Ports, Protocol, Action, TCPFlags, and more simultaneously. You can now apply these filters in the CLI as shown below:
oc netobserv flows \              # Capture flows
--protocol=TCP --port=8080 \      # either on TCP 8080
or --protocol=UDP                 # or UDP
You can see filters being validated during the creation of the agents:
creating flow-capture agents:
opt: filter_protocol, value: TCP
opt: filter_port, value: 8080
opt: add_filter
opt: filter_protocol, value: UDP
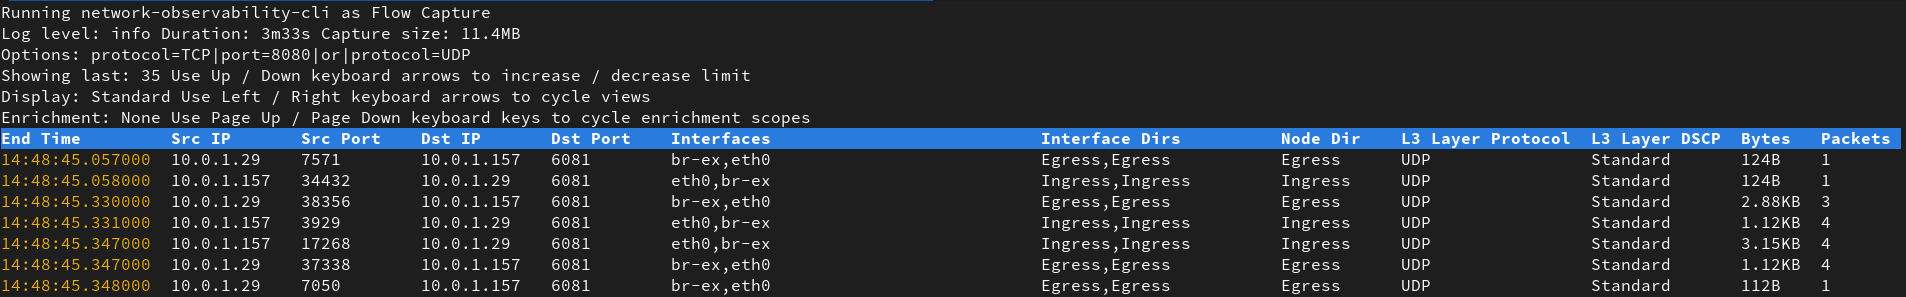
You can add up to 16 sets of filters separated by the or operator to create multiple capture scenarios.
Regular Expressions Usage
If you need to filter on enriched content beyond the agent-level filters, you can use regexes to match any field/value pair. To keep only the traffic from OpenShift namespaces, for example, you can use --regexes=SrcK8S_Namespace~openshift.*.
You see regexes being validated during the creation of the agents:
creating flow-capture agents:
opt: filter_regexes, value: SrcK8S_Namespace~openshift.*
key: SrcK8S_Namespace value: openshift.*
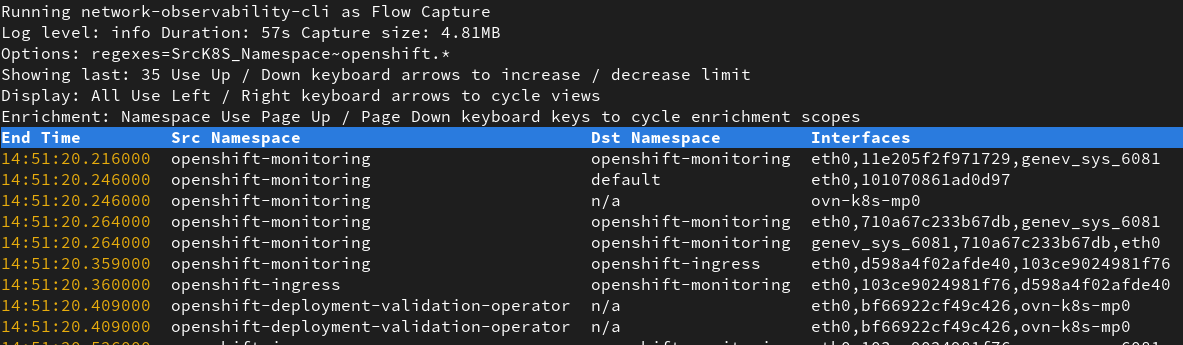
Regexes are comma-separated, so you can use multiple at once, such as --regexes=SrcK8S_Namespace~my-ns,SrcK8S_Name~my-app. Refer to the flows format to see the possible fields.
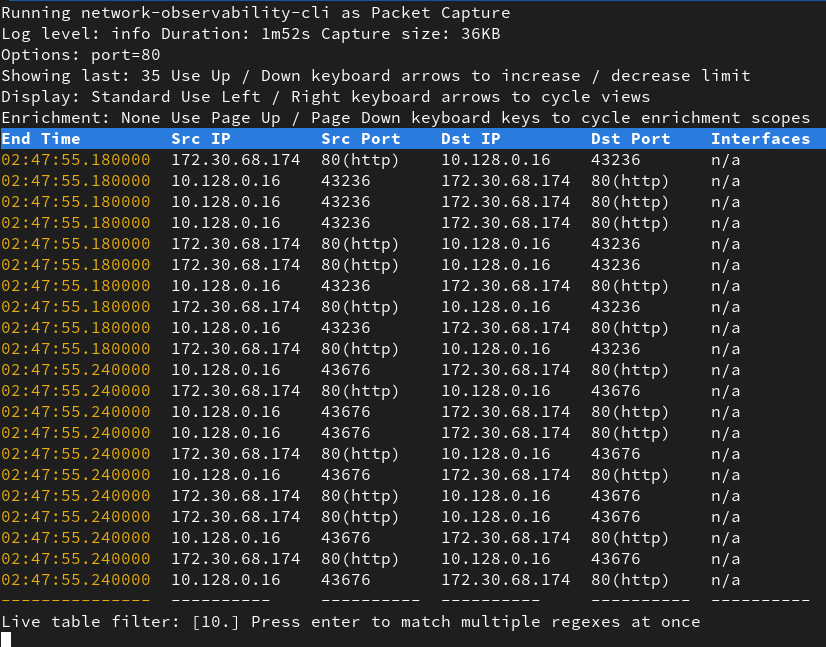
Unified Collector User Experience
All filtering capabilities are now supported for packets capture and displays enriched data while collecting. This improvement was made possible by introducing the flowlogs-pipeline component inside eBPF agents, which parses packets and generates flows from them.
Run a packet capture on a specific port for example:
oc netobserv packets --port=80
Metrics Capture on OpenShift
Capturing metrics is now possible using the metrics command. This creates a ServiceMonitor to gather metrics from the agents and store them in Prometheus. You can enable all or specific features to gather more information about your network, such in:
oc netobserv metrics --enable_all
to capture packet drops, DNS and RTT metrics or
oc netobserv metrics --enable_pkt_drop
to focus only on drops.
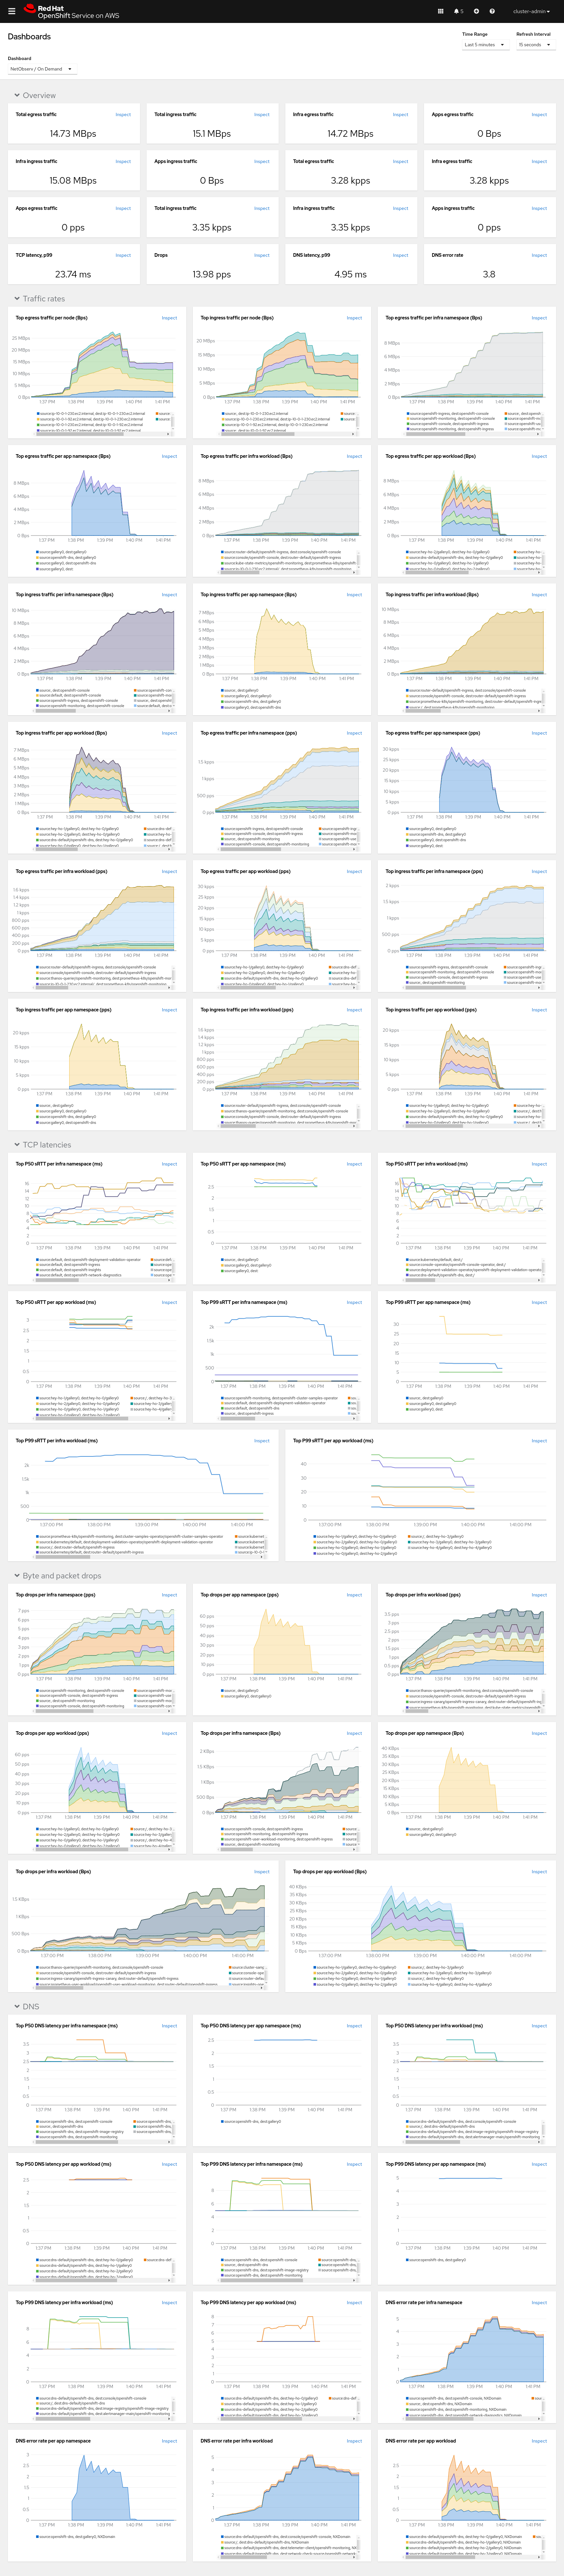
On top of the features, you can use all the filtering capabilities mentioned above to focus on what you're looking for. A NetObserv / On Demand dashboard is automatically created, showing the results.
In this mode, the maximum bytes or time options are ignored since there is no collector pod involved. Only the eBPF agents are deployed.
You need to run stop or cleanup command to remove everything.
Help!
The help has been enhanced to provide examples for each command and option. You can type oc netobserv help for the general help message:
$ oc netobserv help

Netobserv CLI allows you to capture flows, packets and metrics from your cluster.
Find more information at: https://github.com/netobserv/network-observability-cli/

Syntax: netobserv [flows|packets|metrics|follow|stop|copy|cleanup|version] [options]

main commands:
  flows      Capture flows information in JSON format using collector pod.
  metrics    Capture metrics information in Prometheus using a ServiceMonitor (OCP cluster only).
  packets    Capture packets information in pcap format using collector pod.

extra commands:
  cleanup    Remove netobserv components and configurations.
  copy       Copy collector generated files locally.
  follow     Follow collector logs when running in background.
  stop       Stop collection by removing agent daemonset.
  version    Print software version.

basic examples:
  netobserv flows --drops         # Capture dropped flows on all nodes
  netobserv packets --port=8080   # Capture packets on port 8080
  netobserv metrics --enable_all  # Capture all cluster metrics with pktDrop, dns, rtt and network events features

advanced examples:
  Capture drops in background and copy output locally
    netobserv flows --background \                            # Capture flows using background mode
    --max-time=15m \                                          # for a maximum of 15 minutes
    --protocol=TCP --port=8080 \                              # either on TCP 8080
    or --protocol=UDP                                         # or UDP
    netobserv follow                                          # Display the progression of the background capture
    netobserv stop                                            # Stop the background capture by deleting eBPF agents
    netobserv copy                                            # Copy the background capture output data
    netobserv cleanup                                         # Cleanup netobserv CLI by removing the remaining collector pod

  Capture packets on specific nodes and port
    netobserv packets                                         # Capture packets
    --node-selector=netobserv:true \                          # on nodes labelled with netobserv=true
    --port=80 \                                               # on port 80 only
    --max-bytes=100000000                                     # for a maximum of 100MB
You can also request help on a specific command, such as oc netobserv metrics help, to get its options list:
$ oc netobserv metrics help

Netobserv CLI allows you to capture metrics on your OCP cluster.
Find more information at: https://github.com/netobserv/network-observability-cli/

Syntax: netobserv metrics [options]

features:
  --enable_all:                 enable all eBPF features                   (default: false)
  --enable_dns:                 enable DNS tracking                        (default: false)
  --enable_network_events:      enable network events monitoring           (default: false)
  --enable_pkt_translation:     enable packet translation                  (default: false)
  --enable_pkt_drop:            enable packet drop                         (default: false)
  --enable_rtt:                 enable RTT tracking                        (default: false)
  --enable_udn_mapping:         enable User Defined Network mapping (default: false)
  --get-subnets:                get subnets informations                   (default: false)

filters:
  --action:                     filter action                              (default: Accept)
  --cidr:                       filter CIDR                                (default: 0.0.0.0/0)
  --direction:                  filter direction                           (default: n/a)
  --dport:                      filter destination port                    (default: n/a)
  --dport_range:                filter destination port range              (default: n/a)
  --dports:                     filter on either of two destination ports  (default: n/a)
  --drops:                      filter flows with only dropped packets     (default: false)
  --icmp_code:                  filter ICMP code                           (default: n/a)
  --icmp_type:                  filter ICMP type                           (default: n/a)
  --node-selector:              capture on specific nodes                  (default: n/a)
  --peer_ip:                    filter peer IP                             (default: n/a)
  --peer_cidr:                  filter peer CIDR                           (default: n/a)
  --port_range:                 filter port range                          (default: n/a)
  --port:                       filter port                                (default: n/a)
  --ports:                      filter on either of two ports              (default: n/a)
  --protocol:                   filter protocol                            (default: n/a)
  --regexes:                    filter flows using regular expression      (default: n/a)
  --sport_range:                filter source port range                   (default: n/a)
  --sport:                      filter source port                         (default: n/a)
  --sports:                     filter on either of two source ports       (default: n/a)
  --tcp_flags:                  filter TCP flags                           (default: n/a)
  --interfaces:                 interfaces to monitor                      (default: n/a)
Feedback
We hope you enjoyed this article!
NetObserv is an open source project available on github. Feel free to share your ideas, use cases or ask the community for help.