Network Observability On Demand Use Cases
Julien Pinsonneau

Julien Pinsonneau
@jpinsonneauUpdate
Check out the revised version of this post on the Red Hat developers blog: Network Observability On Demand Use Cases.
Network Observability On Demand use cases
Thanks to: Mohamed Mahmoud, Joël Takvorian, Sara Thomas and Amogh Rameshappa Devapura for reviewing
If you haven't read it yet, take a look at CLI 1.8 update article to list the new introduced features in release 1.8.
For each of the following use cases, you must have the netobserv CLI installed and you need to be connected to your cluster using:
oc login <CLUSTER_API_URL> --username <CLUSTER_ADMIN> --password <PASSWORD>
To observe what the CLI deploys on your cluster, you can run the oc events -n netobserv-cli -w command to watch all the events happening in the netobserv-cli namespace.
The result look like:
LAST SEEN   TYPE     REASON             OBJECT                    MESSAGE
0s          Normal   SuccessfulCreate   DaemonSet/netobserv-cli   Created pod: netobserv-cli-t2vlr
0s          Normal   Scheduled          Pod/netobserv-cli-t2vlr   Successfully assigned netobserv-cli/netobserv-cli-t2vlr to ip-10-0-1-202.ec2.internal
0s          Normal   SuccessfulCreate   DaemonSet/netobserv-cli   Created pod: netobserv-cli-hlmxx
0s          Normal   Scheduled          Pod/netobserv-cli-hlmxx   Successfully assigned netobserv-cli/netobserv-cli-hlmxx to ip-10-0-1-220.ec2.internal
0s          Normal   Pulling            Pod/netobserv-cli-t2vlr   Pulling image "quay.io/netobserv/netobserv-ebpf-agent:main"
0s          Normal   Pulling            Pod/netobserv-cli-hlmxx   Pulling image "quay.io/netobserv/netobserv-ebpf-agent:main"
0s          Normal   Pulled             Pod/netobserv-cli-hlmxx   Successfully pulled image "quay.io/netobserv/netobserv-ebpf-agent:main" in 2.049s (2.049s including waiting)
0s          Normal   Created            Pod/netobserv-cli-hlmxx   Created container netobserv-cli
0s          Normal   Started            Pod/netobserv-cli-hlmxx   Started container netobserv-cli
0s          Normal   Pulled             Pod/netobserv-cli-t2vlr   Successfully pulled image "quay.io/netobserv/netobserv-ebpf-agent:main" in 5.376s (5.376s including waiting)
0s          Normal   Created            Pod/netobserv-cli-t2vlr   Created container netobserv-cli
0s          Normal   Started            Pod/netobserv-cli-t2vlr   Started container netobserv-cli
0s          Normal   Scheduled          Pod/collector             Successfully assigned netobserv-cli/collector to ip-10-0-1-220.ec2.internal
0s          Normal   AddedInterface     Pod/collector             Add eth0 [10.129.0.35/23] from ovn-kubernetes
0s          Normal   Pulling            Pod/collector             Pulling image "quay.io/netobserv/network-observability-cli:main"
0s          Normal   Pulled             Pod/collector             Successfully pulled image "quay.io/netobserv/network-observability-cli:main" in 1.724s (1.724s including waiting)
0s          Normal   Created            Pod/collector             Created container collector
0s          Normal   Started            Pod/collector             Started container collector
North / South and East / West traffic
The CLI is able to read configurations from cluster-config-v1 and network to identify Machine, Pods, and Services subnets using the --get-subnets option. This automatically add SrcSubnetLabel and DstSubnetLabel to your flows.
You can see subnets being configured during the creation of the agents:
creating flow-capture agents:
opt: get_subnets, value: true
Found subnets:
    Services: "172.30.0.0/16"
    Pods: "10.128.0.0/14"
    Machines: "10.0.0.0/16"
Once running, you can cycle to different views using the left / right arrow keys and change the displayed enrichment columns using the page up / down keys. Also, to adapt to your screen height, you can increase / decrease the number of displayed flows using the up / down arrow keys.
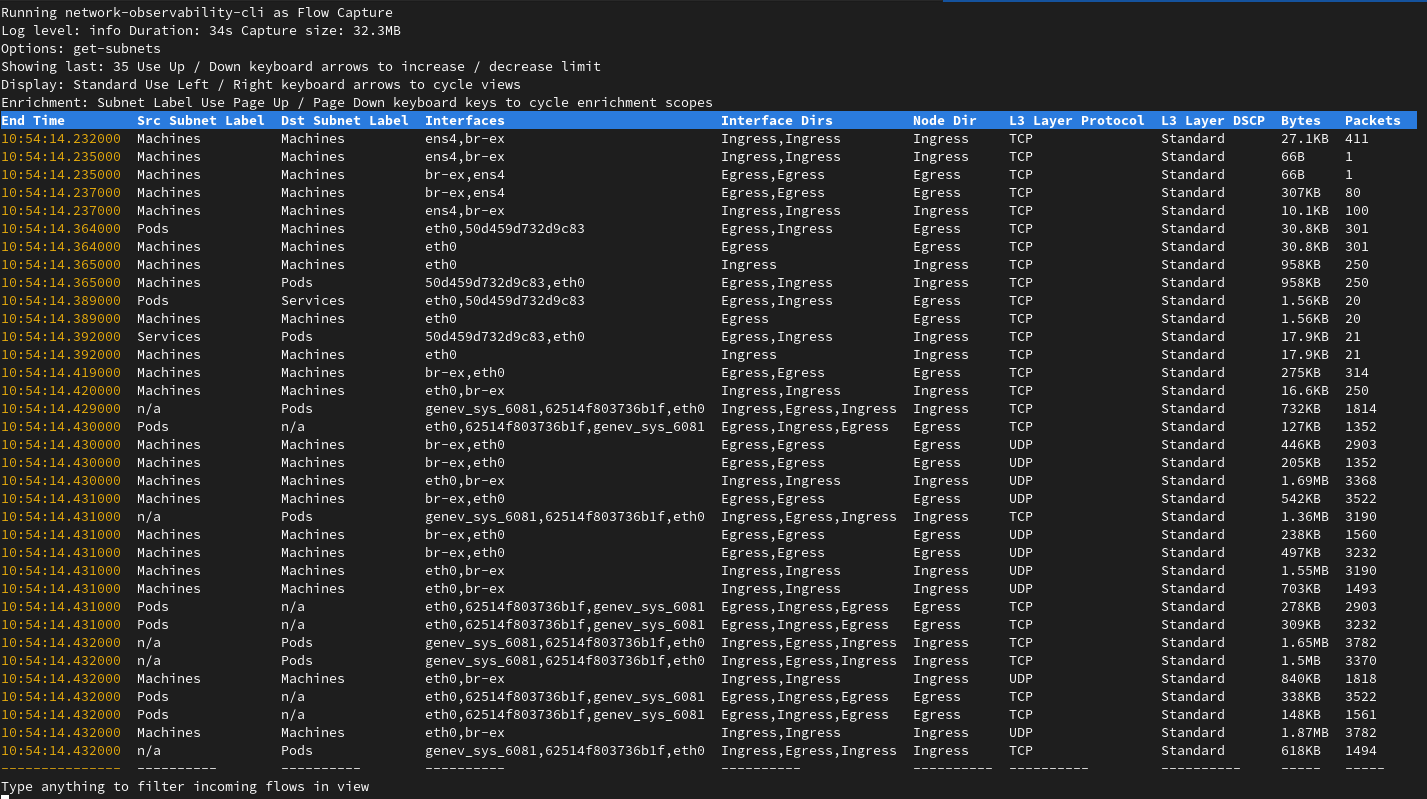
You can live-filter this capture by typing Machines, Pods or Services keywords to only see what you look for here.
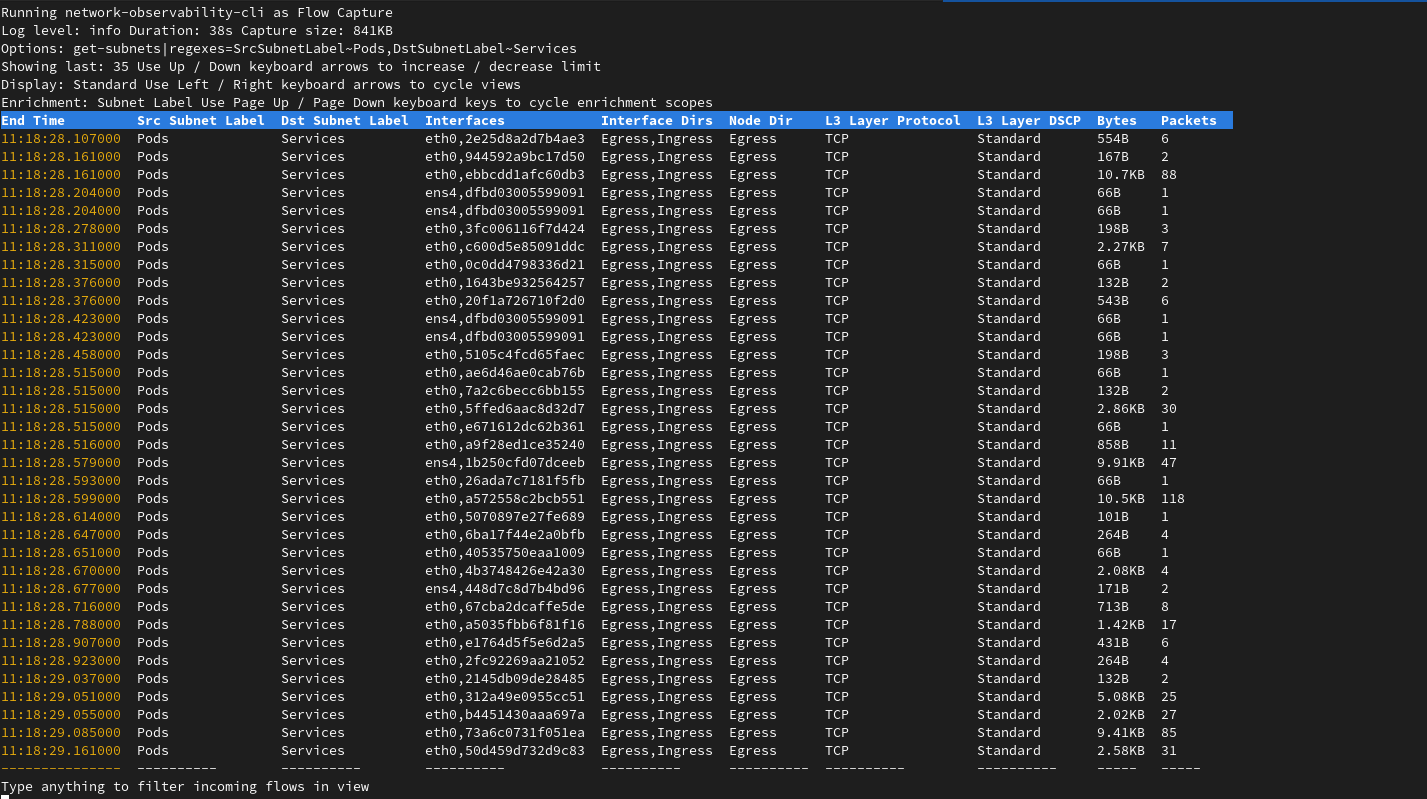
However, if you want to capture only a subset of these flows, you can use the regexes filter on top such as in the following example:
oc netobserv flows --get-subnets --regexes=SrcSubnetLabel~Pods,DstSubnetLabel~Services
WARNING: Running regexes filters means that all the flows are captured and enriched before applying this filter stage in the pipeline. To avoid performance impact on your cluster, use eBPF filters such as IPs, Ports and Protocol as most as possible.
The output is now only showing Pods to Services flows:
Connectivity check(s) between two endpoints
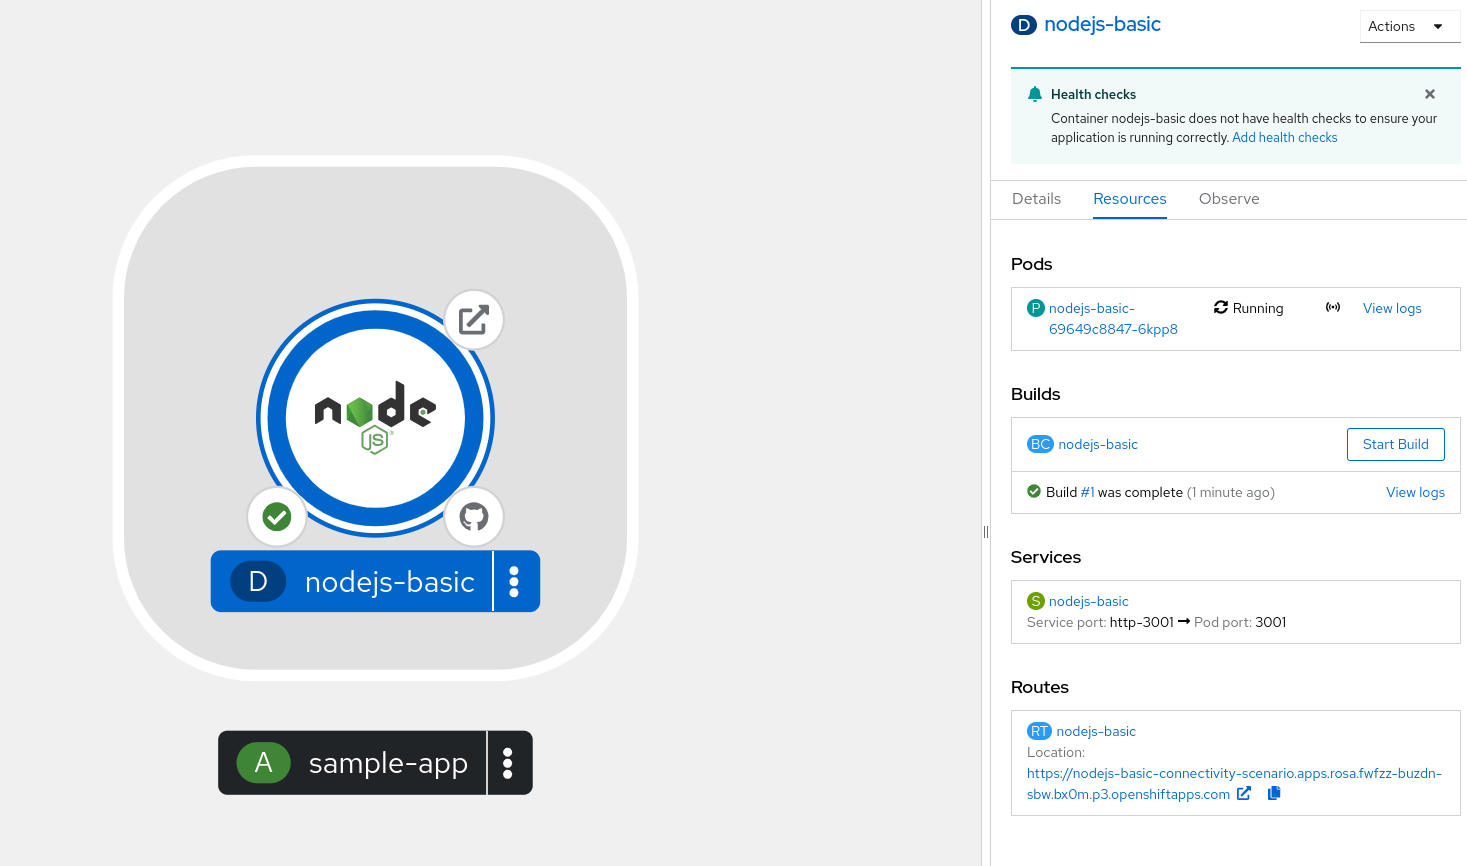
Let's start with a simple case where you have a pod not able to reach an endpoint. We are using a simple nodejs sample app deployed in connectivity-scenario namespace for the demo.
This could be related to many issues such as:
- DNS issue
- Policy or kernel drops
- Configuration issue (such as UDN)
- Timeouts
Since we don't know what we are looking for yet, we should enable all the features using the options:
--enable_all
By clicking on the pod name, we can see that our current pod IP is 10.129.0.48. To capture all the traffic going in and out of this pod, we use the filter:
--peer_ip=10.129.0.48
Alternatively, you could also use the service port:
--port=3001
Finally, you can add a node selector label on top:
--node-selector=kubernetes.io/hostname:my-node
WARNING: Running the capture without filtering is also an option, but it is not recommended as it collects all the flows of the cluster. Depending of the size of your cluster, this could be a lot and make the collector pod crash.
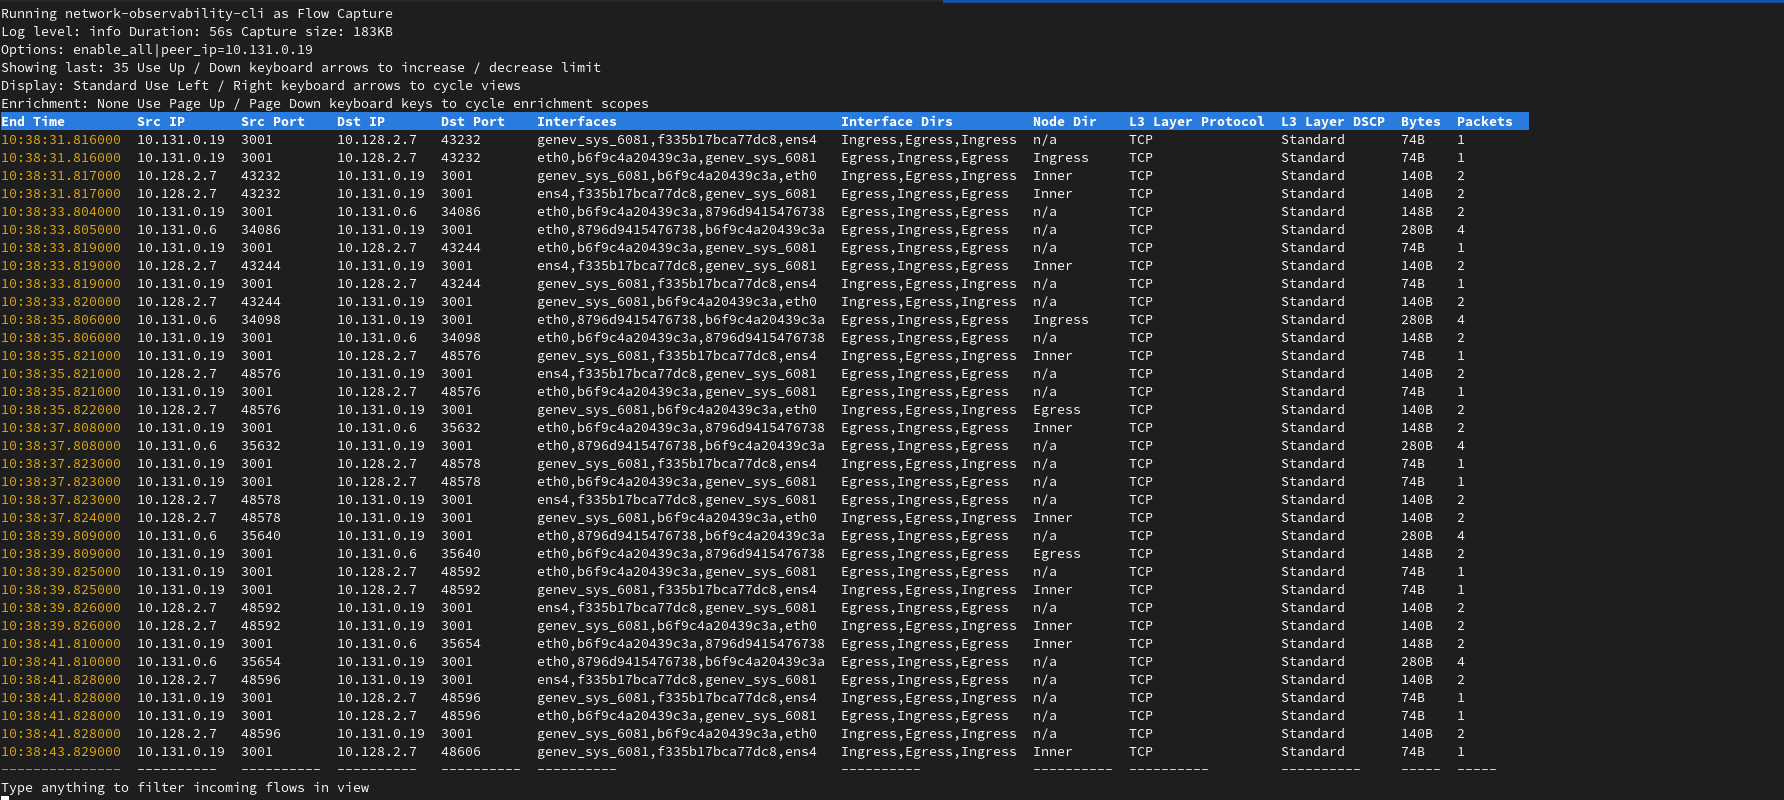
All together, the command to run flow capture with all the features on our pod IP is:
oc netobserv flows --enable_all --peer_ip=10.131.0.19
The script connects to your cluster and start deploying eBPF agents and collector pod:
Checking dependencies...
'yq' is up to date (version v4.43.1).
'bash' is up to date (version v5.2.26).
Setting up...
cluster-admin
creating netobserv-cli namespace
namespace/netobserv-cli created
creating service account
serviceaccount/netobserv-cli created
clusterrole.rbac.authorization.k8s.io/netobserv-cli unchanged
clusterrolebinding.rbac.authorization.k8s.io/netobserv-cli unchanged
creating collector service
service/collector created
creating flow-capture agents:
opt: pkt_drop_enable, value: true
opt: dns_enable, value: true
opt: rtt_enable, value: true
opt: network_events_enable, value: true
opt: udn_enable, value: true
opt: pkt_xlat_enable, value: true
opt: filter_peer_ip, value: 10.129.0.19
daemonset.apps/netobserv-cli created
Waiting for daemon set "netobserv-cli" rollout to finish: 0 of 2 updated pods are available...
Waiting for daemon set "netobserv-cli" rollout to finish: 1 of 2 updated pods are available...
daemon set "netobserv-cli" successfully rolled out
Running network-observability-cli get-flows...
pod/collector created
pod/collector condition met
Once that done, it connects to the collector and display its output:
------------------------------------------------------------------------
         _  _     _       _                       ___ _    ___
        | \| |___| |_ ___| |__ ___ ___ _ ___ __  / __| |  |_ _|
        | .' / -_)  _/ _ \ '_ (_-</ -_) '_\ V / | (__| |__ | |
        |_|\_\___|\__\___/_.__/__/\___|_|  \_/   \___|____|___|

------------------------------------------------------------------------
INFO[0000] Log level: info
Option(s): enable_all|peer_ip=10.129.0.19
INFO[0000] Kernel version: 5.14.0-427.50.1.el9_4.x86_64
INFO[0000] Starting Flow Capture...
INFO[0000] Creating database...
INFO[0000] flows.db created
INFO[0000] Create flows table...
INFO[0000] flows table created
At this stage, the collector wait for incoming data. If nothing shows yet, it means that no traffic is captured. Try to open the route of your application or update the filters of the capture.
- If you are using a standard cluster, cycle to the packet drops view. In this capture, we see that the traffic is dropped by OVS:

You will need to investigate to get the root cause but it's probably a configuration such as a network policy.
- If you are using
TechPreviewfeature, cycle to the network events view. In this capture, we see that the traffic is blocked by a network policy:

Edit your network policies and give another try.
Behind the scenes in our scenario, we used to have a deny all on the pod label:
kind: NetworkPolicy
apiVersion: networking.k8s.io/v1
metadata:
  name: deny-nodejs
  namespace: connectivity-scenario
spec:
  podSelector:
    matchLabels:
      app: nodejs-basic
  policyTypes:
    - Ingress
    - Egress
Once you updated your policies, you can give another try to your route until you fix the issue:
The drop / network event disappears and your route should open correctly now. On top of that, you can ensure that the Round Trip Time is correct. If you are still experiencing issues with the route, you may update / get rid of the filter(s) and play with live filtering.
-
While running a capture, you can place additionnal live filters to the view by simply typing keywords on your keyboard such as
nodejs:
-
And add as many keywords as you want by pressing enter:
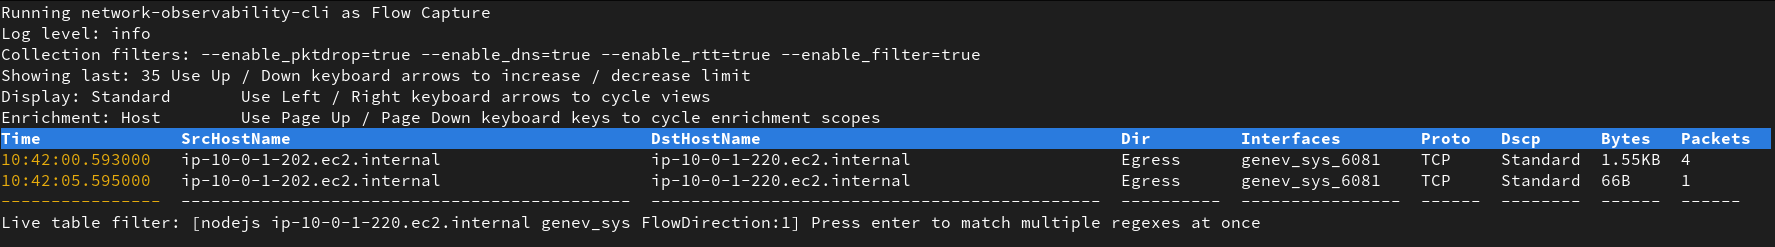
-
If your deployment involves some DNS resolution, you can switch to the DNS display and show latencies and errors: Once you updated your policies, you can give another try to your route until you fix the issue:
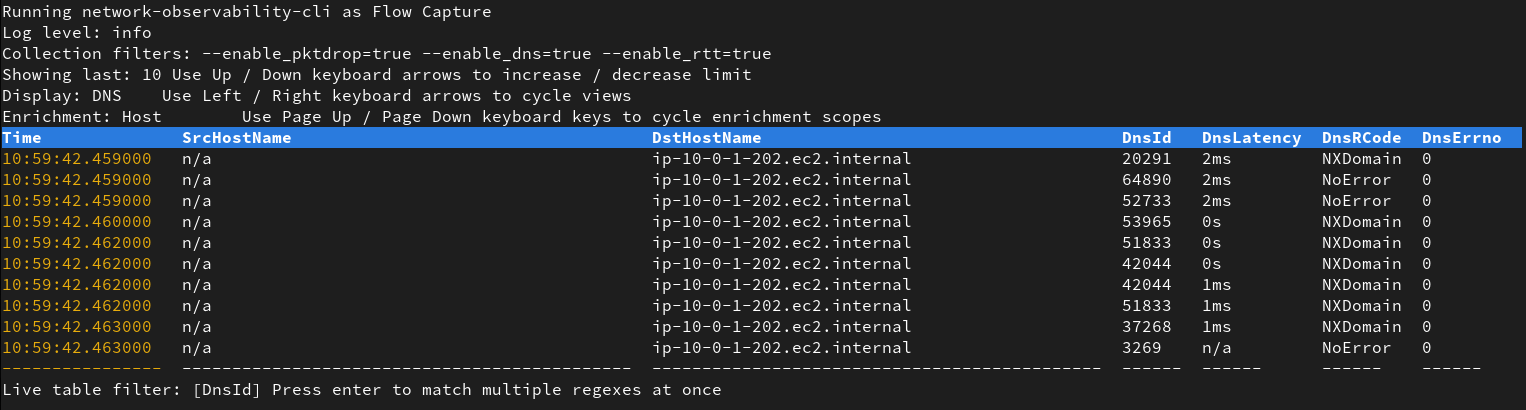
Those
NxDomainerrors could be from a misconfiguration in your app deployment trying to reach the wrong domain. -
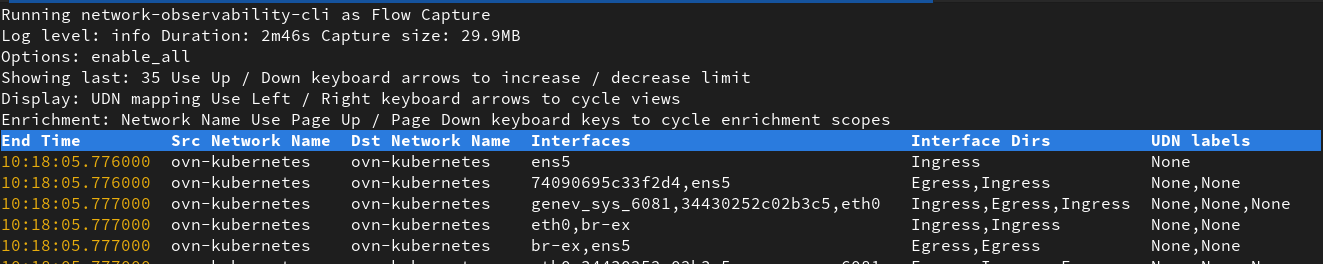
To check which network is involved, you can switch to Network Name enrichment and UDN display. This is showing you which network name, interfaces, direction and User Defined Network name involved.
Once you are done, simply press CTRL + C to exit. Your capture is copied to your local machine for post mortem analysis.
That's the end of the first scenario about connectivity checks !
User Defined Network (Dev Preview)
As developer preview, you can enrich flows to get User Defined Network (UDNs) information. To do so, you can use the --enable_udn_mapping option.
To configure your UDNs, refer to the official documentation.
Our primary UDN in this example is defined as:
apiVersion: k8s.ovn.org/v1
kind: UserDefinedNetwork
metadata:
  name: primary-udn
  namespace: user-defined-network
spec:
  layer2:
    role: Primary
    subnets:
      - 10.0.0.0/24
  topology: Layer2
Once everything is configured, you can inspect your pods YAML and look for the k8s.v1.cni.cncf.io/network-status annotation:
kind: Pod
apiVersion: v1
metadata:
  name: pod-a
  namespace: user-defined-network
...
  annotations:
...
    k8s.v1.cni.cncf.io/network-status: |-
      [{
          "name": "ovn-kubernetes",
          "interface": "eth0",
          "ips": [
              "10.131.0.35"
          ],
          "mac": "0a:58:0a:83:00:23",
          "dns": {}
      },{
          "name": "ovn-kubernetes",
          "interface": "ovn-udn1",
          "ips": [
              "10.0.0.4"
          ],
          "mac": "0a:58:0a:00:00:04",
          "default": true,
          "dns": {}
      }]
...
Note that eth0 is the default pod network and ovn-udn1is the User Defined Network. We are going to filter on its IP: 10.0.0.4.
As this IP is not unique across the cluster, we can add a filter on the port 8080 which is used in this example and the node annotation kubernetes.io/hostname=ci-ln-cfqkhfb-72292-6l8l5-worker-c-lrr4q matching the node running this pod.
All together, the command is as follows:
oc netobserv flows --enable_udn_mapping --peer_ip=10.0.0.4 --port=8080 --node-selector=kubernetes.io/hostname:ci-ln-cfqkhfb-72292-6l8l5-worker-c-lrr4q
Once you run the command, it waits for the flows to come. In this scenario, we simply run a curl between two pods under the same UDN. You can cycle to UDN mapping display once you get your flows to see which UDN is involved.
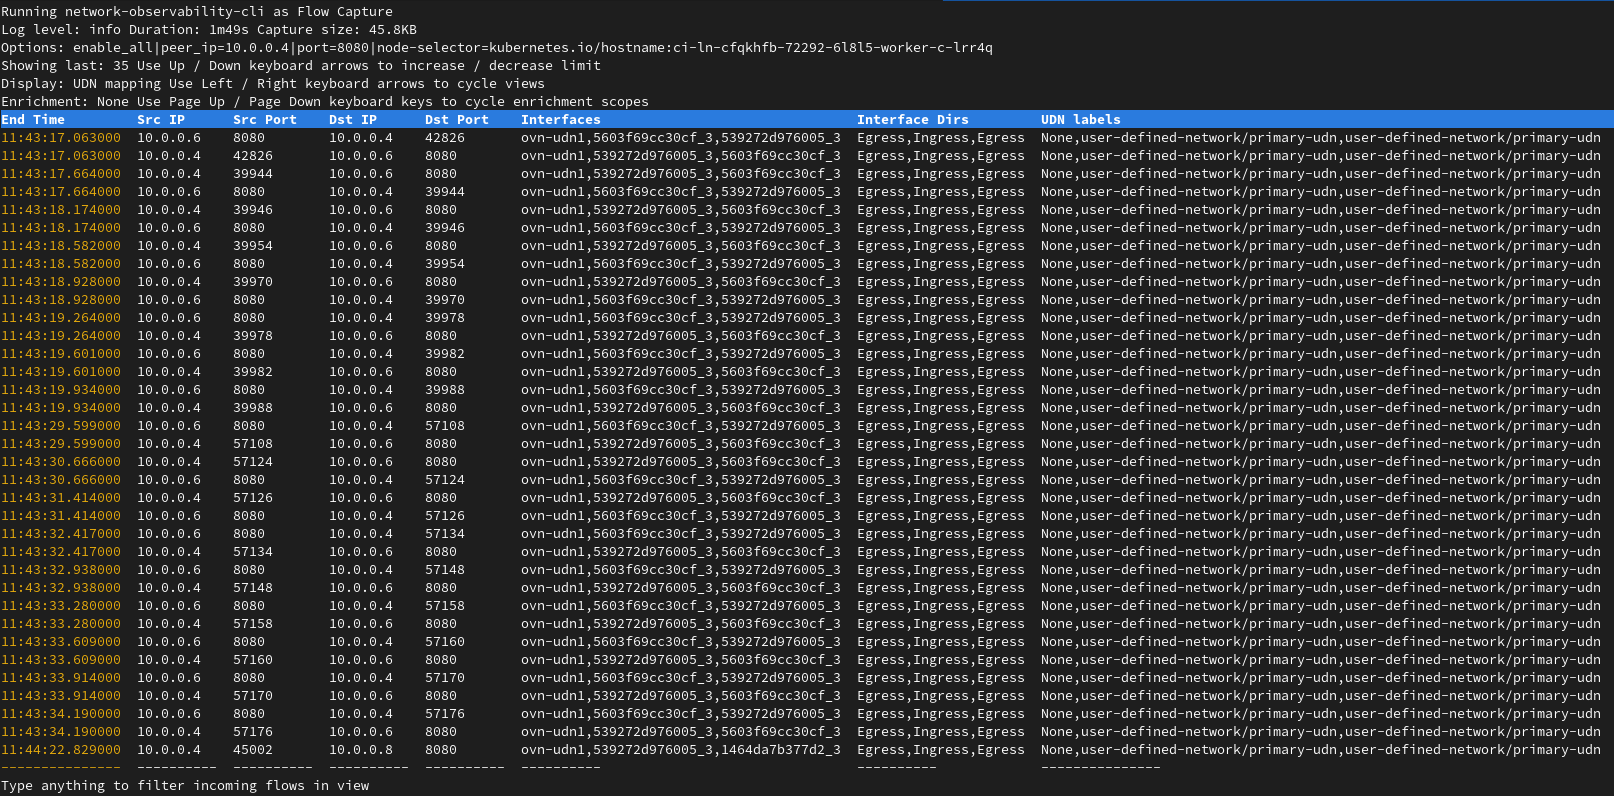
You can retreive the namespace user-defined-network and the name primary-udn from the UDN labels column.
Identify unknown traffic content
In this next scenario, we are going to dig into unknown packets using unencrypted traffic on TCP protocol on port 80. We usually avoid such usage on production cluster and would like to understand who's involved in these.
For the demo purepose, we are using again a nodejs basic deployment, exposing unencrypted traffic on port 80 in packet-capture-scenario namespace.
Let's start a packet capture using the following command:
oc netobserv packets --protocol=TCP --port=80
Similarly to the previous scenario, the script connects to your cluster and starts deploying the eBPF agents and collector pod but capturing full packet content this time.
Once first packet is captured, you see a table with the amount of packets and bytes:
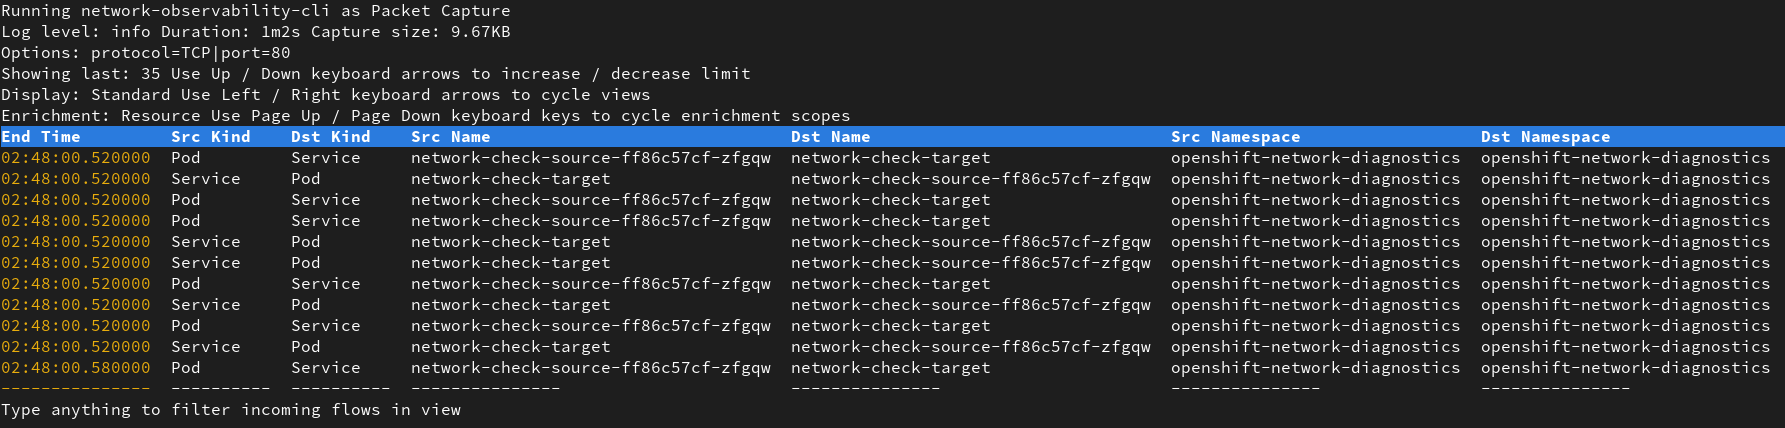
You can cycle between the view to see IPs and ports instead of resources:
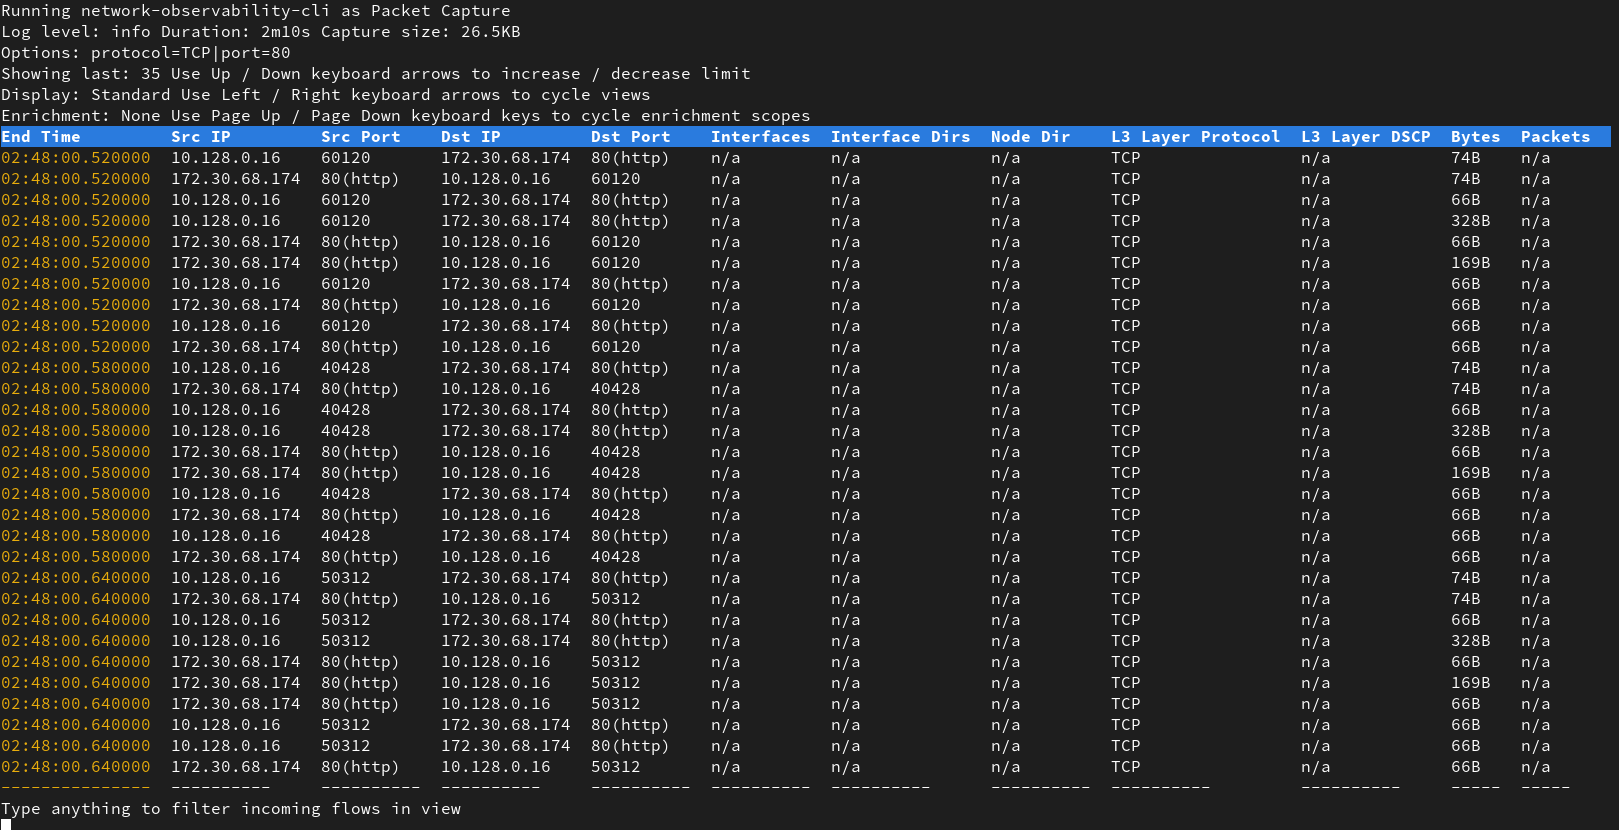
Let the capture run enough time to get some packets and press CTRL + C to exit.
Open the generated pcap file using Wireshark and look for your IP as source for example:
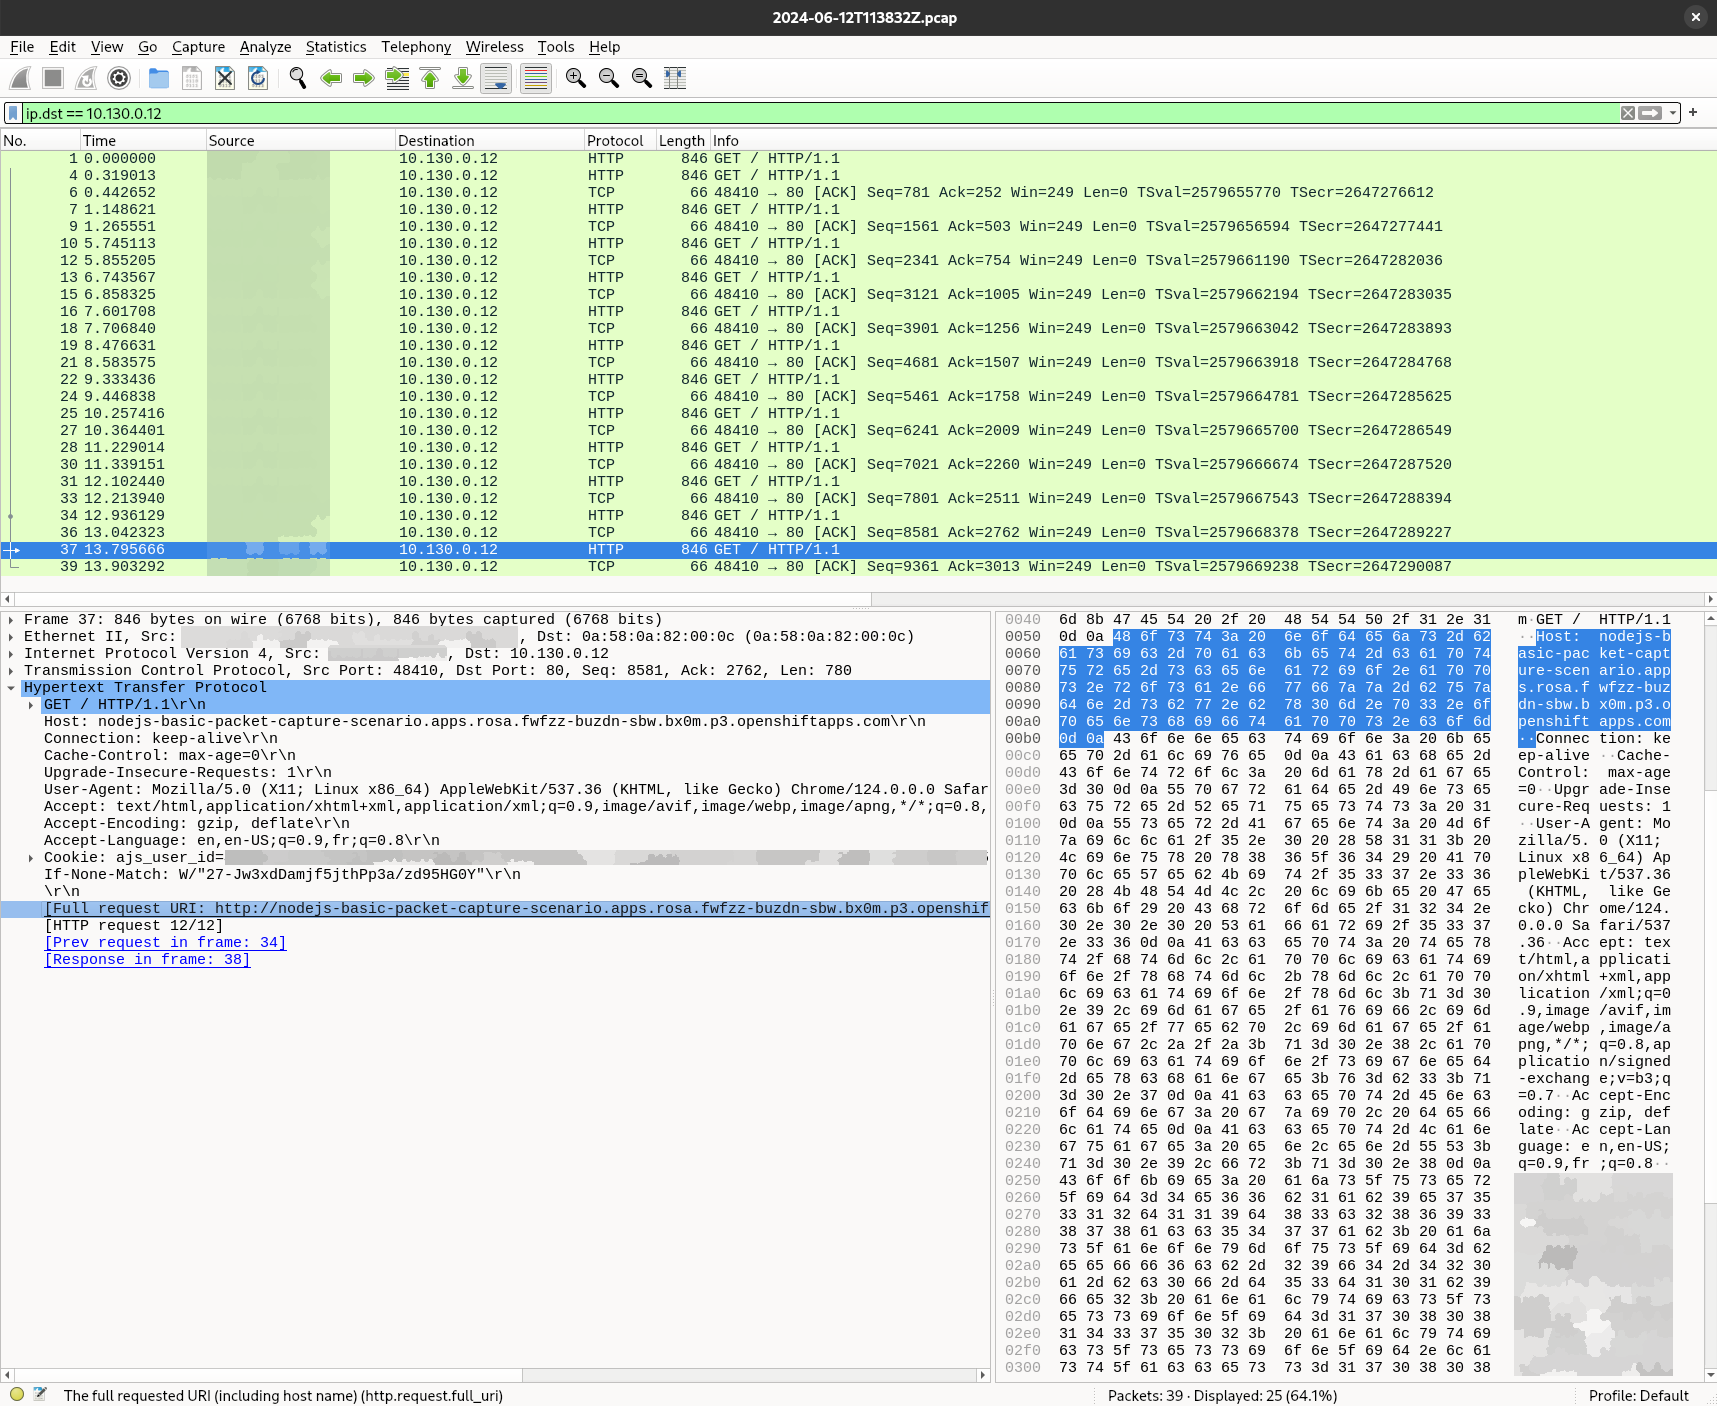
This time, we can see the HTTP content and see the request URL and response. Since we have the entire payload, we cand check for any authentification header, cookie, encoding and so on that may be wrong. This is useful to identify traffic content but also to debug a deployment that may be misconfigured or requesting unexpected content on unencrypted connections.
Encrypted traffic
What about encrypted traffic ?
Most of the time, your traffic should be secured and you do not have access to the data it holds. However, Wireshark has the ability to decrypt the content if you provide the proper secrets. However, getting these secrets may be tricky depending on where the encryption happens and needs some juggling. If you are looking for the traffic between your browser and the cluster, you can simply run the following command to capture pre-master-secret keylog file:
SSLKEYLOGFILE="keylog.txt" chromium-browser &
This generated file contains each client and server traffic secrets to decode your packets.
Then in Wireshark, specify the file path in Edit→Preferences→Protocols→TLS→(Pre)-Master-Secret log filename. A single file can hold keys for multiple TLS connections.
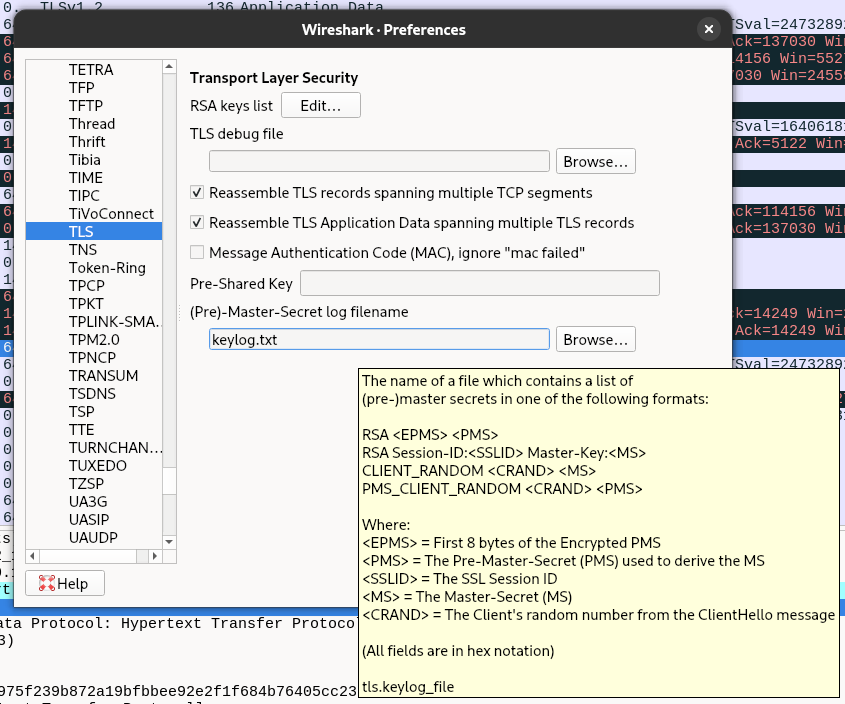
You should now have access to decrypted packets !
What about a secure connection between two pods ?
For these cases, you need to have a good understanding of what's involved behind the scene. If your application relies on OpenSSL, GnuTLS or NSS TLS library, you should be able to set the SSLKEYLOGFILE enviroment variable and extract the result.
For our nodejs example, you need to either use the cli option --tls-keylog or modify the code and subscribe on keylog event. When multiple teams are involved, that may take a while !
Another alternative is a man-in-the-middle approach using a proxy. This can be done using kubetap.
You can install it using krew by running:
oc krew install tap
Then you can run the following command to port forward the traffic of your service to the proxy:
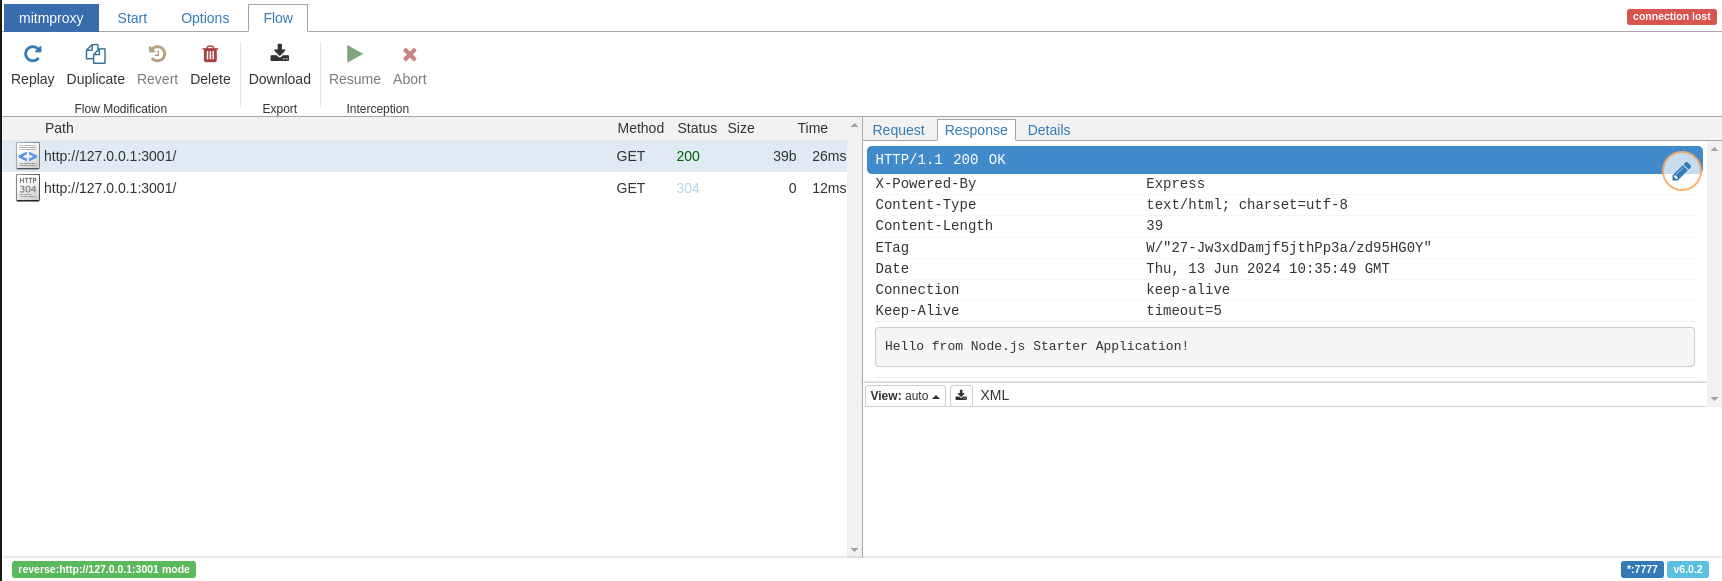
oc tap on -n packet-capture-scenario -p 3001 --https nodejs-basic --port-forward
The output should look like this:
Establishing port-forward tunnels to Service...


Port-Forwards:

  mitmproxy - http://127.0.0.1:2244
  nodejs-basic - http://127.0.0.1:4000
Open the mitm proxy url and generate a query to your route. You can see queries listed in the proxy web UI with the content displayed:
Feedback
We hope you enjoyed this article!
NetObserv is an open source project available on github. Feel free to share your ideas, use cases or ask the community for help.